By Jennifer Bisgard and Nicola Theunissen
As evaluators we are always looking for valid, reliable, and easily collected data. A key challenge is low response rates, particularly when a survey is long and complex. We find that response rates increase substantially when we conduct short, relatively simple surveys. We learned about Net Promoter Scores through an article in Fortune magazine and were intrigued enough to research it further. The methodology was first introduced by Fred Reichfield in a 2003 Harvard Business Review article.
Fred Reichheld and Rob Markey, authors of New York Times bestseller The Ultimate Question 2.0: How Net Promoter Companies Thrive in a Customer-Driven World, trademarked NPS, which has enabled organizations, globally, to sort their clients in three loyalty categories and determine an overall score. Over two-thirds of Fortune 100 companies have adopted the tool as an alternative metric to traditional customer satisfaction research.
The NPS is based on the core question: How likely is it that you would recommend Organization X to a friend or colleague? Respondents are offered a ten-point scale. The innovative element to this scale is the coding of the responses:
- Respondents who say that they will recommend Organization X by rating it either 9 or 10 are coded as Promoters, and can be referred to as enthusiastic or brand ambassadors.
- Those who are more ambivalent or neutral towards Organisation X tend to respond with either 7 or 8, and are considered Passives.
- Respondents who feel negative or dissatisfied and provide responses that rate from 0 to 6 are Detractors.
Once responses are coded into the respective groups, the Net Promoter Score is calculated using the percent of promoters and detractors. Passives are not used to calculate the score because they can go either way.
Here’s how to calculate NPS:
Organization X = (% Promoters – % Detractors) x 100
For example, if 80% rated as promoters (9 or 10), and 10% rate 1-6, your score would be (80% – 10%) x 100 = 70. An NPS of 70 is a very good score as most respondents are promoters.
“Promoters build your business. They stay longer. They buy more. They bring friends. They give you constructive feedback that helps you improve your products and services,” Markey, said in a Forbes interview explaining why remarkable organizations strive to turn passive stakeholders into promoters.
Khulisa put NPS to the test
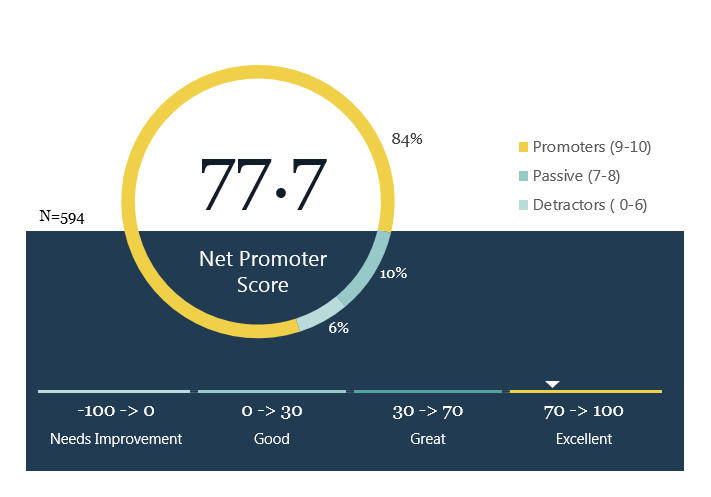
For a recent project on behalf of a client, we asked training participants if they would recommend the training course to a friend/colleague using the NPS survey question. Out of 594 participants, we could see that most (84%) are “promoters”, meaning that they are enthusiastic about the training; while 6% are “detractors”, as seen on the visual. With this, we were able to determine the training’s NPS score of 77.7.

Khulisa has also deployed the NPS methodology to determine clients’ satisfaction with our work. We decided to share the experience, because it was simple and effective and therefore serves as a great feedback tool. We used Survey Monkey to send the NPS survey to 32 clients (for whom we recently completed a contract). We also asked clients “why” and whether we could publically share their comments.
We were happy to attain an NPS of 73 and a range of positive client feedback which we could share publically:
“Khulisa have an array of qualified personnel for planning and implementing Data Quality Assessments.”
FHI360
“Proposal professionally done, quick to respond, flexible and easy to work with. Staff and officers very competent.”
TSP Baylor College of Medicine
“Depth of experience in conducting M&E and quality work.”
USAID/Southern Africa
| We like the NPS methodology because it is standardised and effortless and helped us to obtain a quick appraisal of our recently completed work without wasting clients’ time.
Although we do not use it as a yardstick of internal effectiveness, it served a useful purpose in determining whether clients are satisfied with contract delivery and would make use of our services in the future. |
Very informative information specially liked where you have explained Khulisa & NPS.
Regards
John
Antlere.com
Thanks! We are also using it for our evaluations.
NPS is a very helpful tool to evaluate the customer experience.
The Net Promoter Score is calculated based on responses to a single question: How likely is it that you would recommend our company/product/service to a friend or colleague? The scoring for this answer is most often based on a 0 to 10 scale.