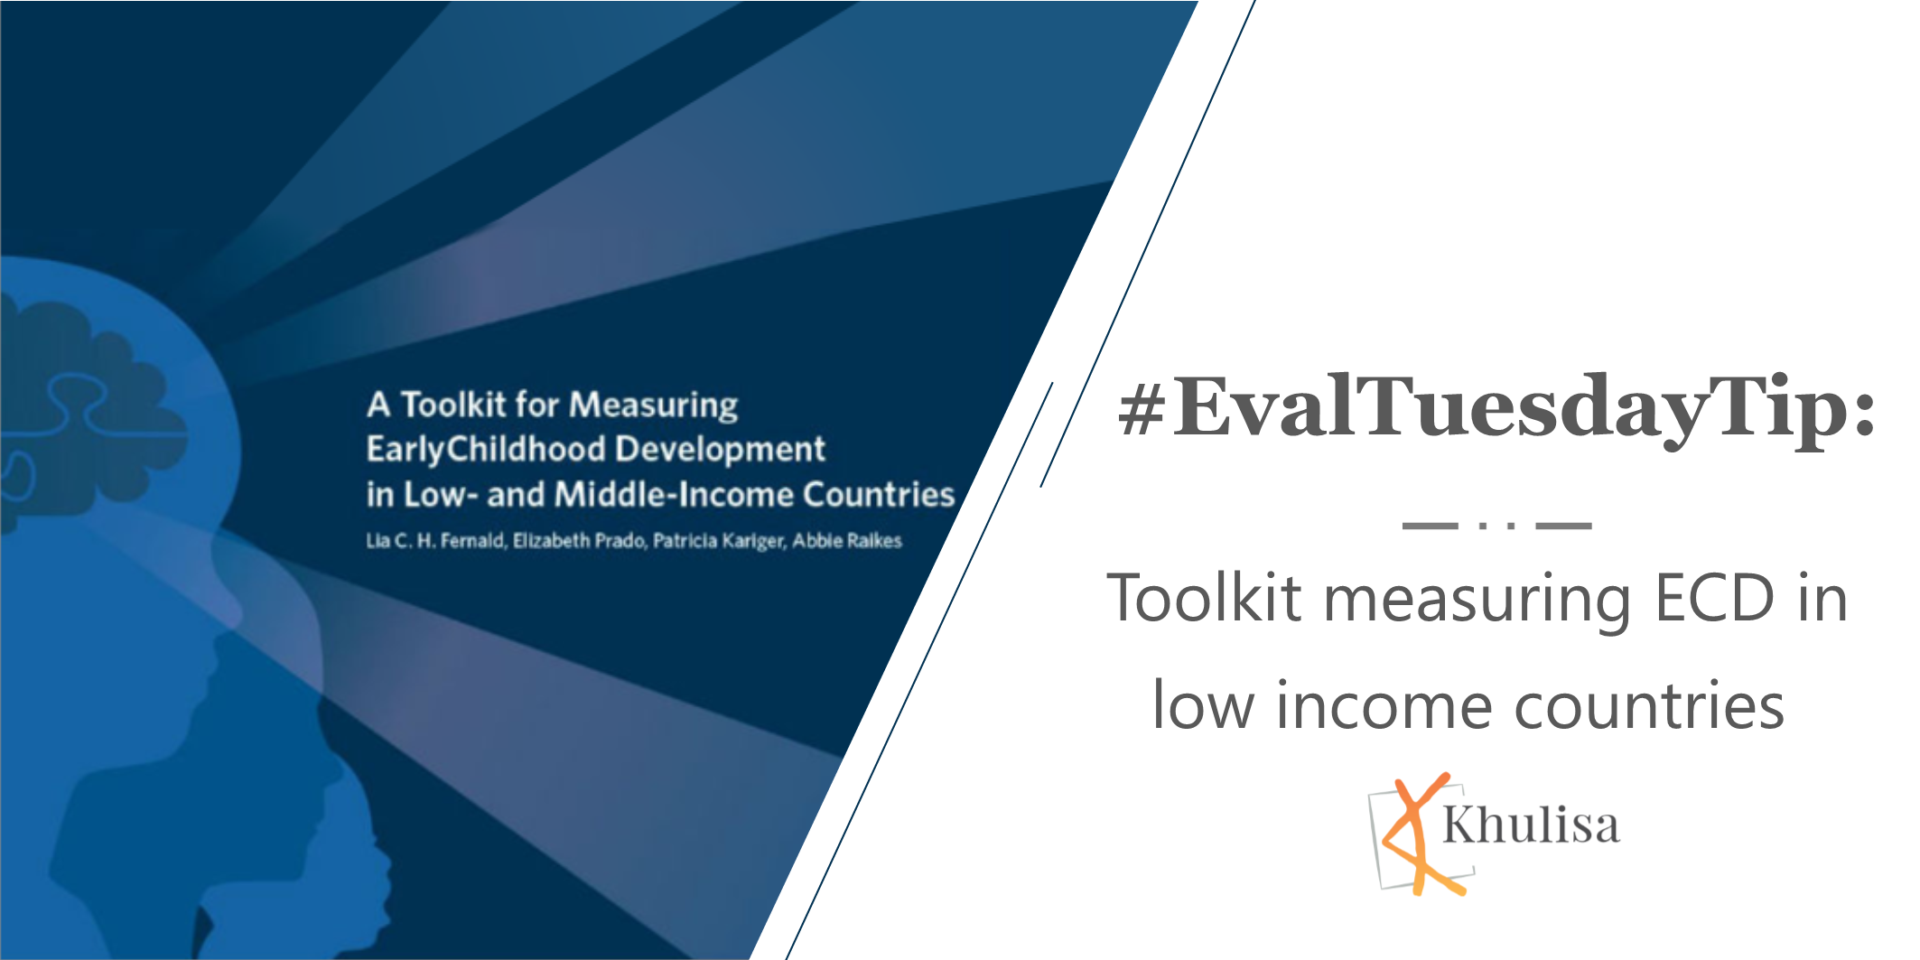
#EvalTuesdayTip: Awesome Early Childhood Development Measurement Toolkit
Khulisa is using this World bank Toolkit for Measuring Early Childhood Development (ECD) . The Toolkit comes with a measurement inventory and an online spreadsheet

Khulisa is using this World bank Toolkit for Measuring Early Childhood Development (ECD) . The Toolkit comes with a measurement inventory and an online spreadsheet

Khulisa uses these fully-editable PowerPoint map templates on yourfreetemplates.com. They include geographic maps of continents, countries, and in some cases provinces, states and districts. For more map visualization tools go to: Tableau
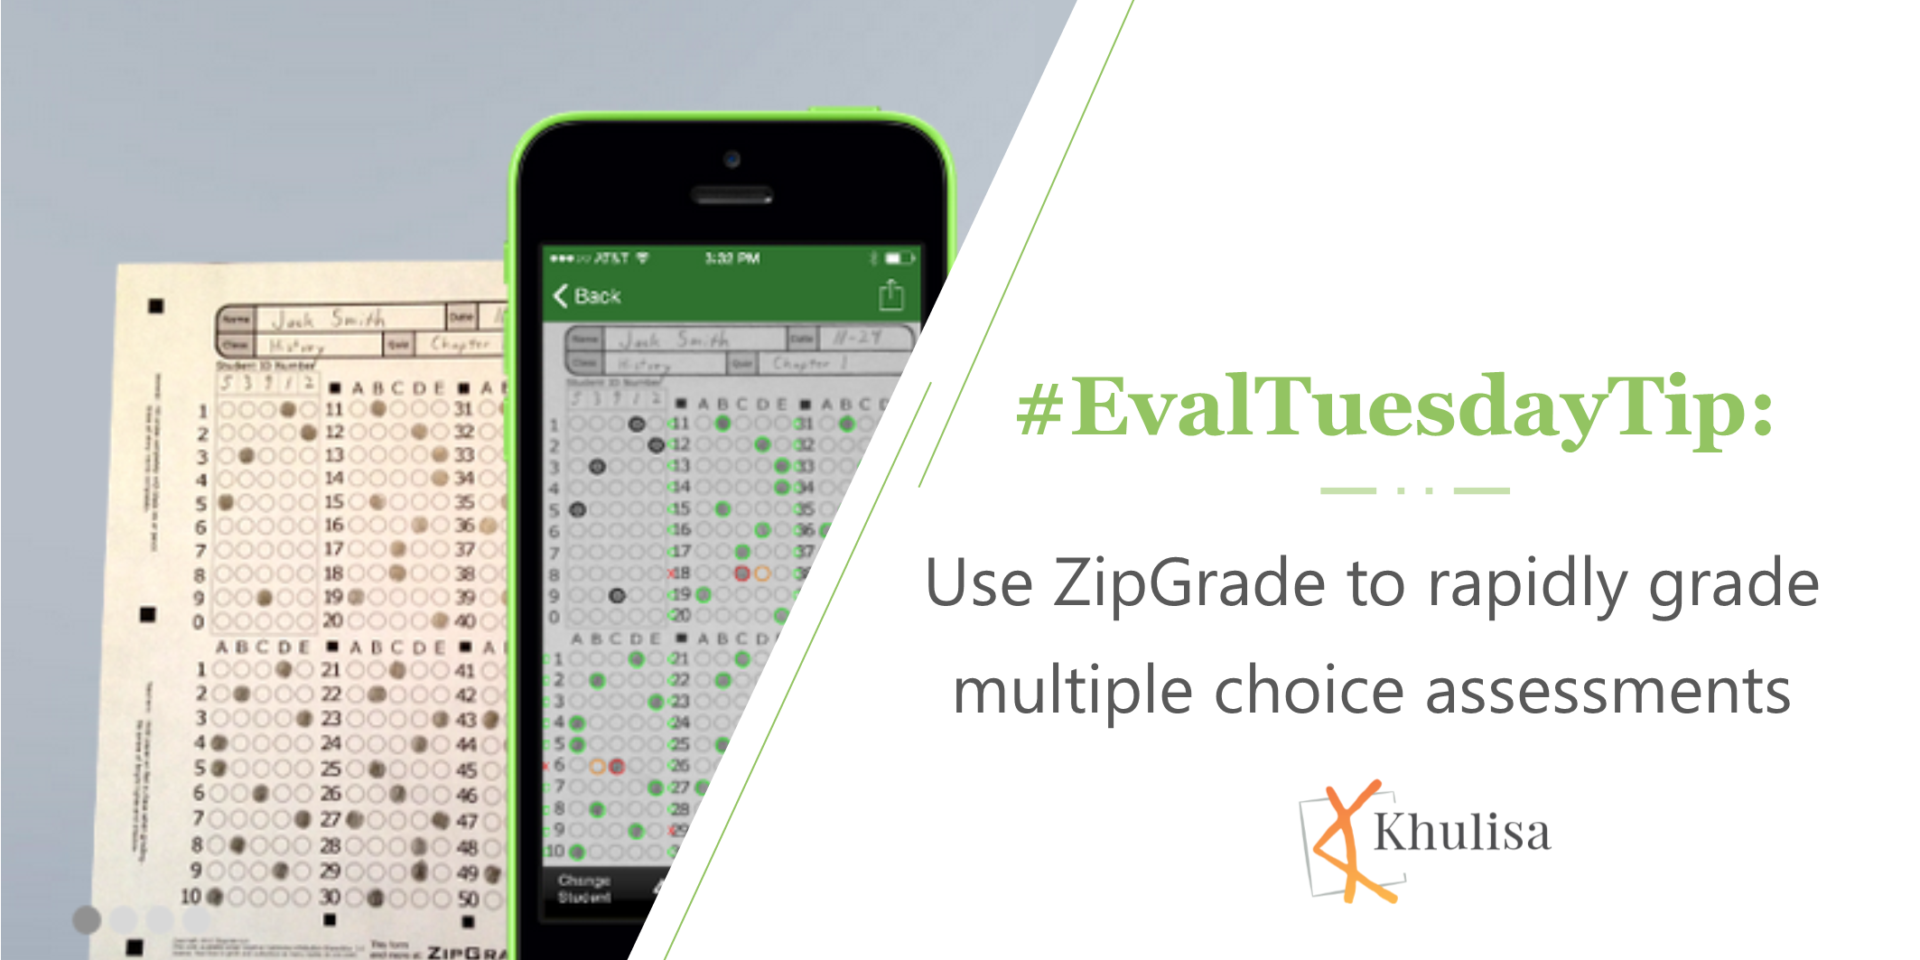
Khulisa will use ZipGrade on an assignment which calls for assessing over a thousand teachers. Until 2011, we used an expensive OCR/form creation software
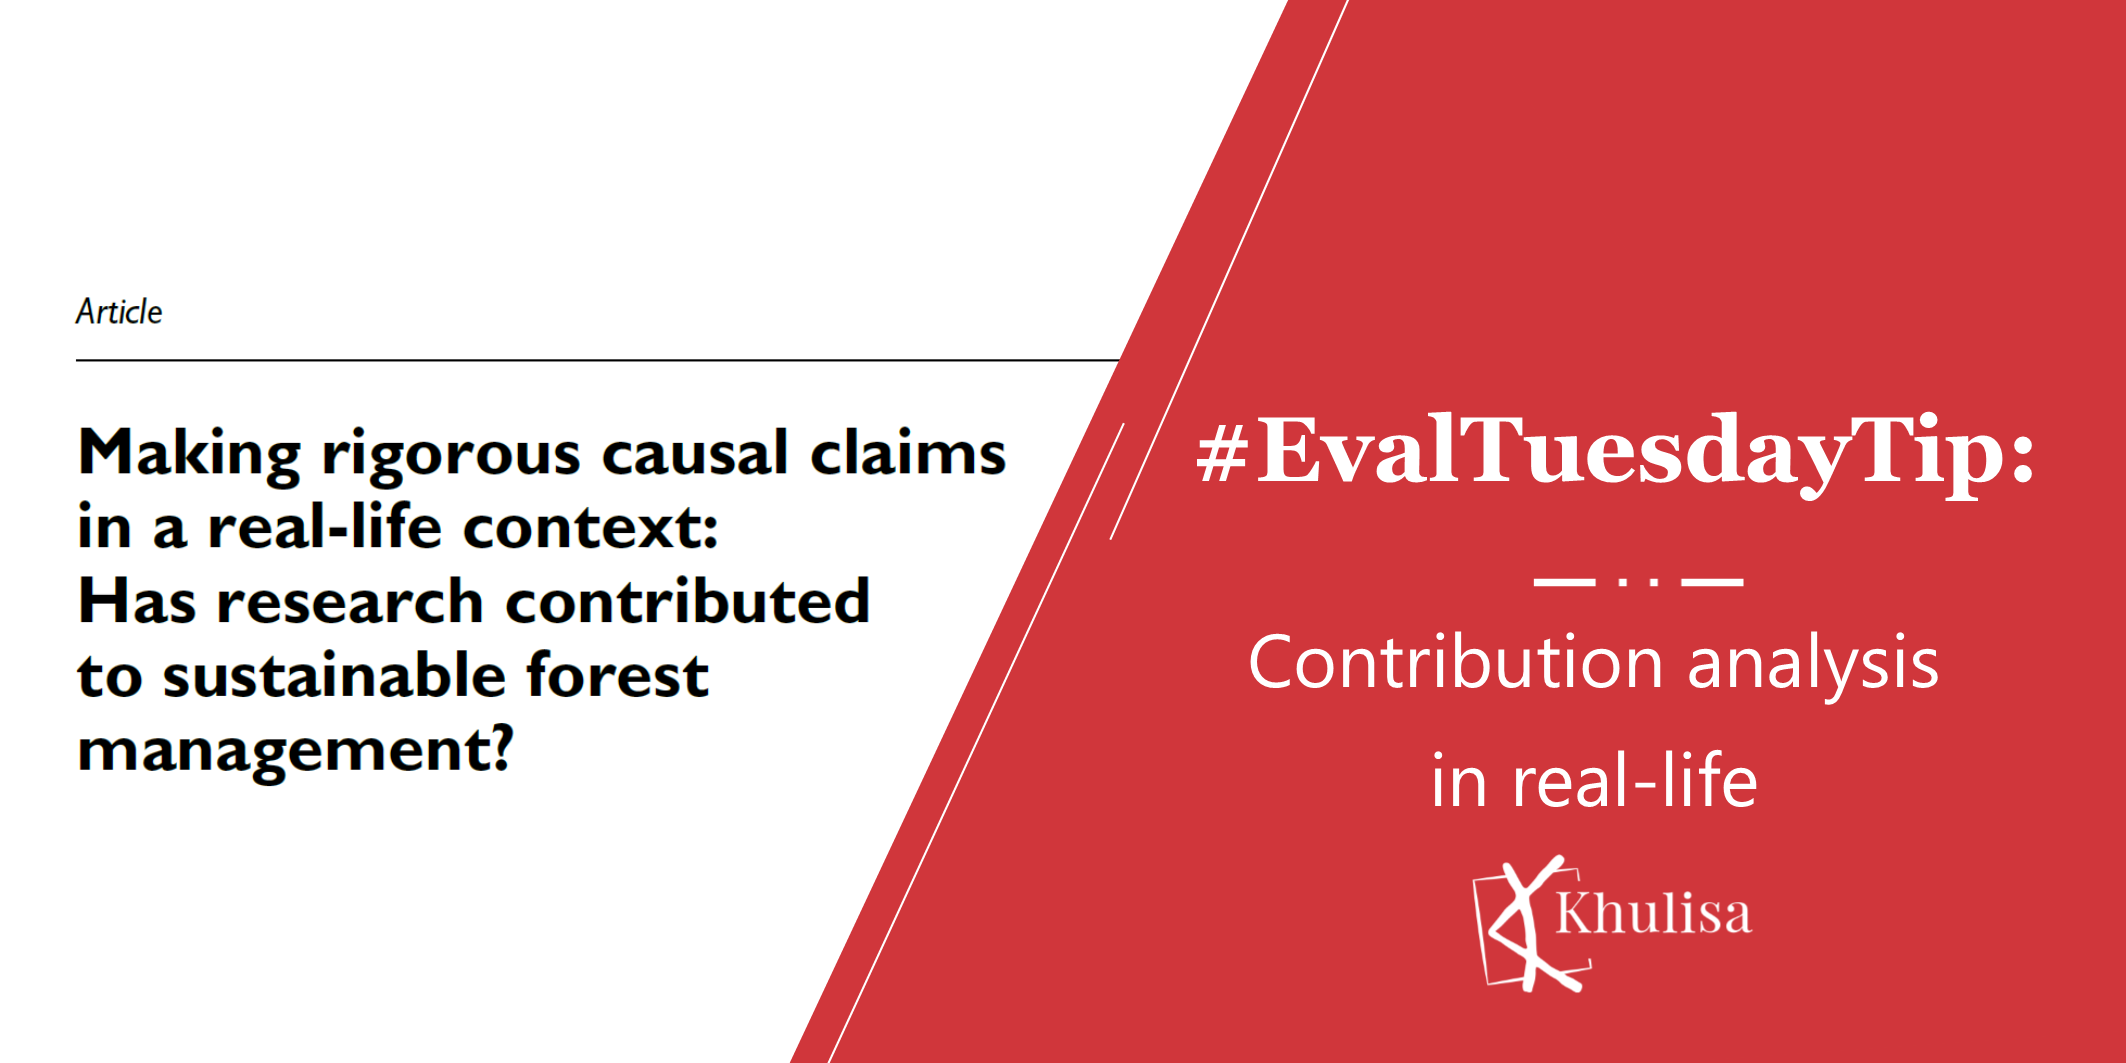
Contribution analysis is a useful evaluation methodology that helps iteratively map evidence against a theory of change and understand to what extent observed outcomes are

Colour is critical for good data visualization in evaluation. Here’s a few tips on how Khulisa uses colour in evaluation reports: Select your colour schemes
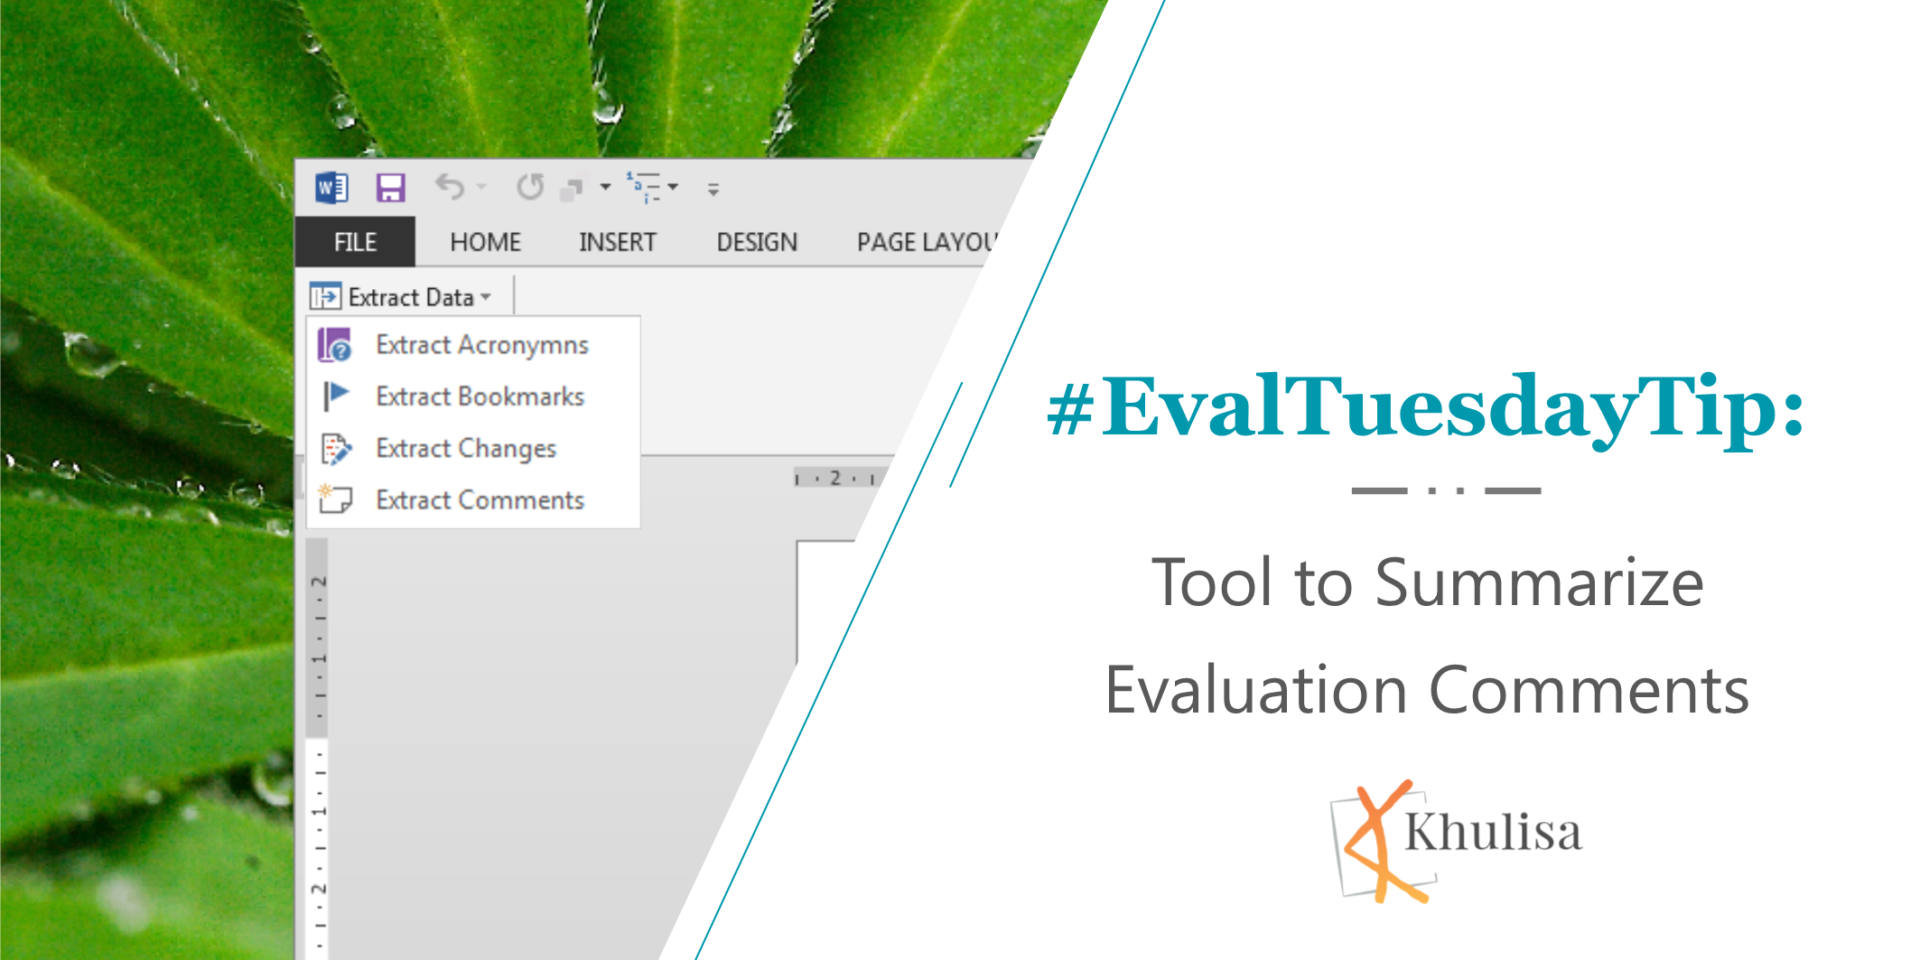
Our clients usually give us feedback on draft evaluations and other reports in comments embedded in the MSWord report. We use DocTools ExtractData ,a free
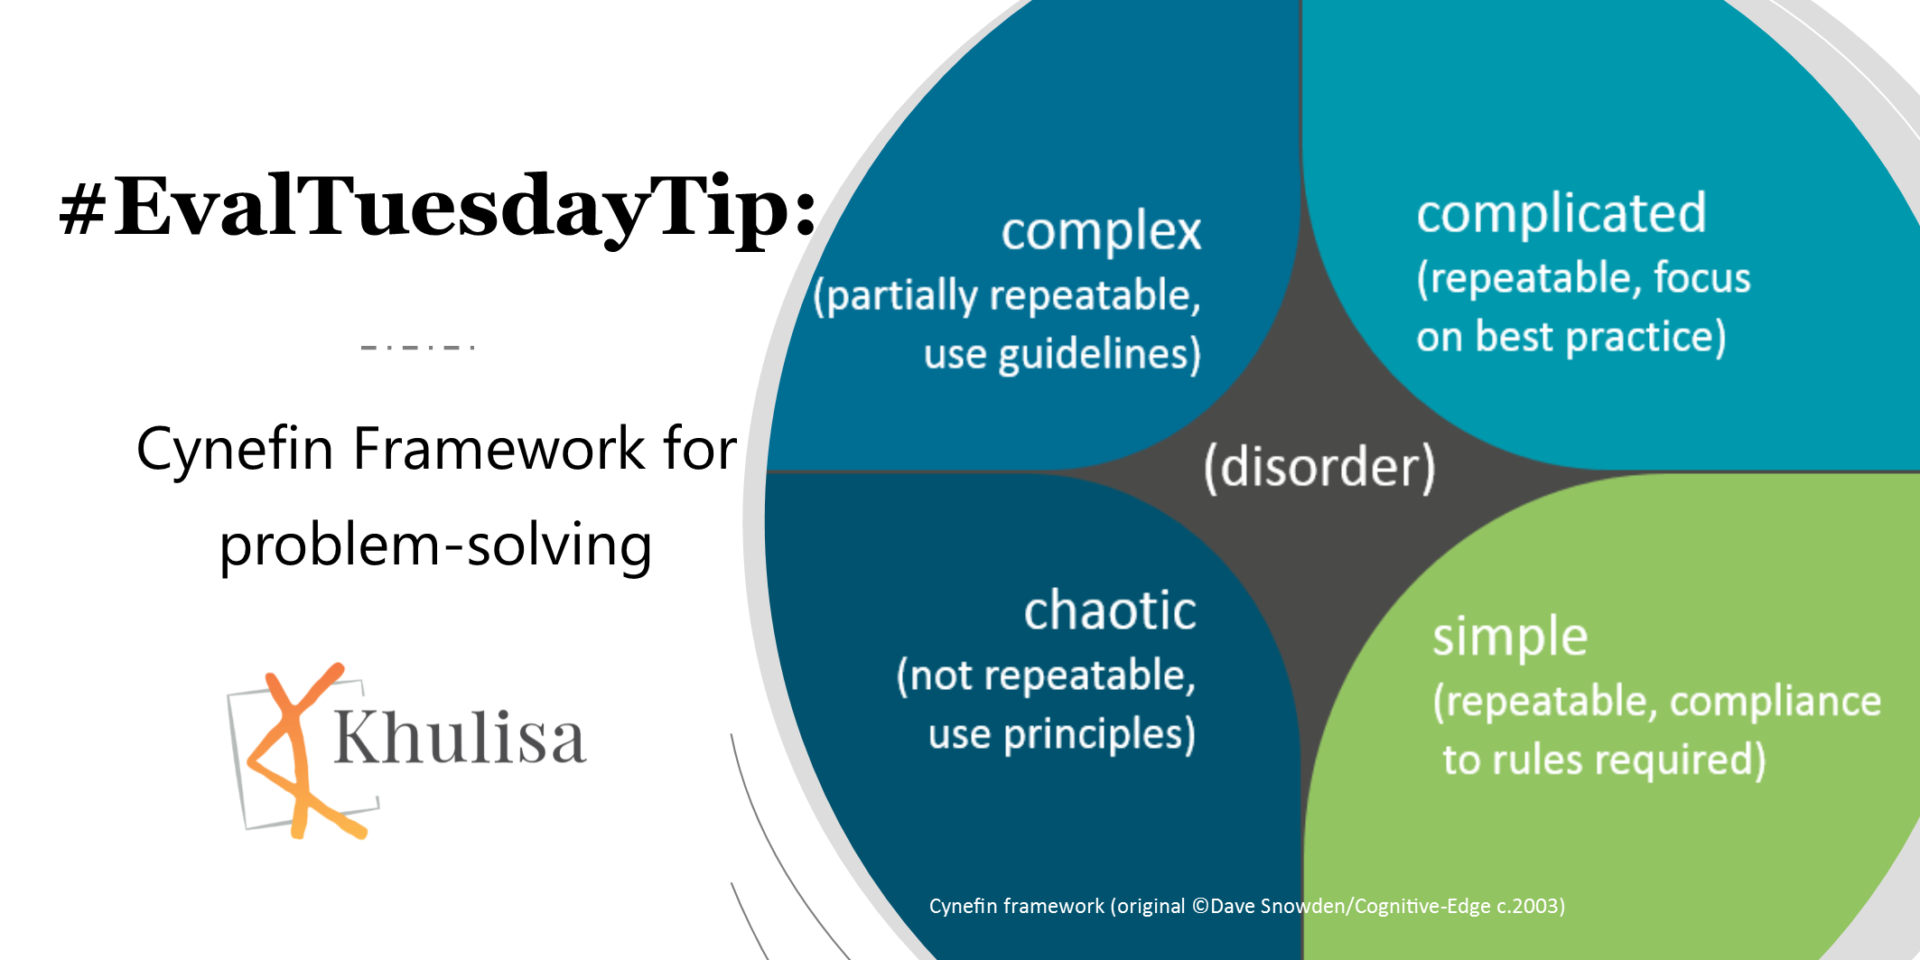
Khulisa often uses the the Cynefin Framework to contextualize and frame the evaluand and thus identify appropriate evaluation methodologies. Cynefin’s roots are in management assessments,
Here’s a great article on a rigorous quali-quantitative approach to establish the validity of contribution claims in impact evaluations. Other accessible resources on process tracing
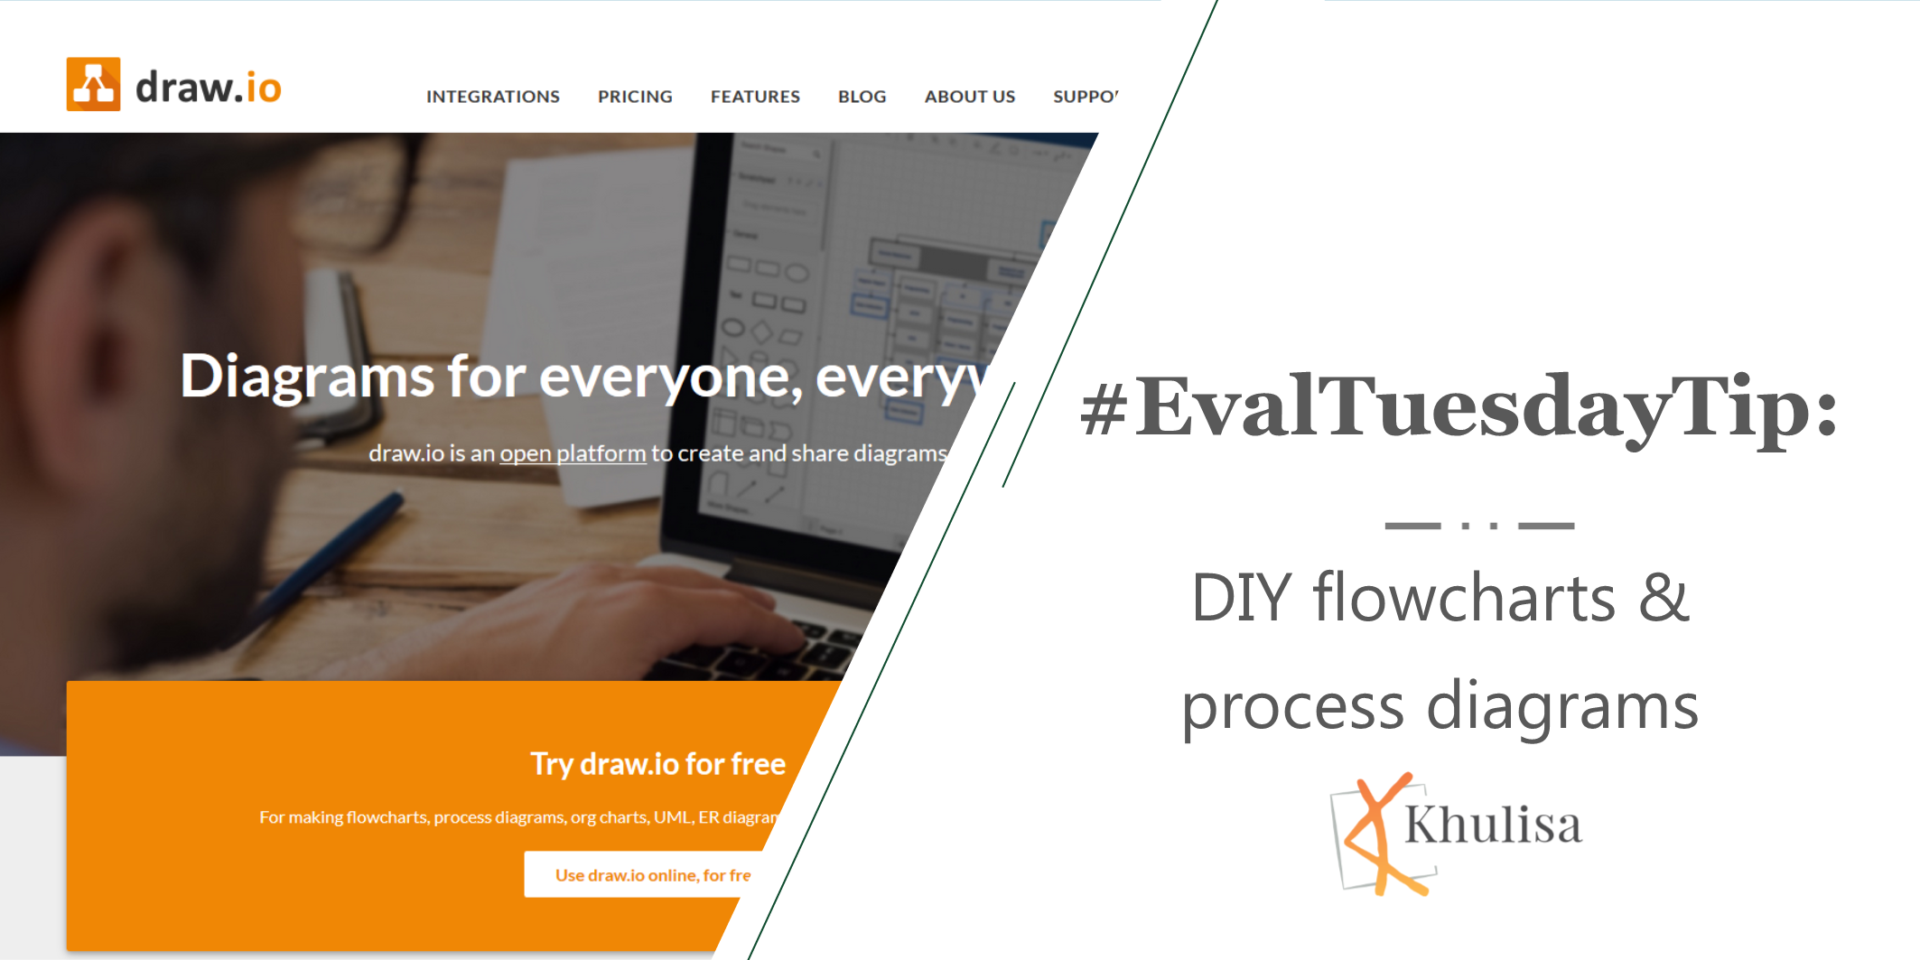
Khulisa recently started to use Draw.io to diagram clients’ Theory of Change. This open-source application allows you to make fabulous flowcharts, process diagrams and organization
Khulisa finds the generic “Stallings Classroom Snapshot Instrument” useful for classroom observation in education evaluations. It was developed by the World Bank and is an