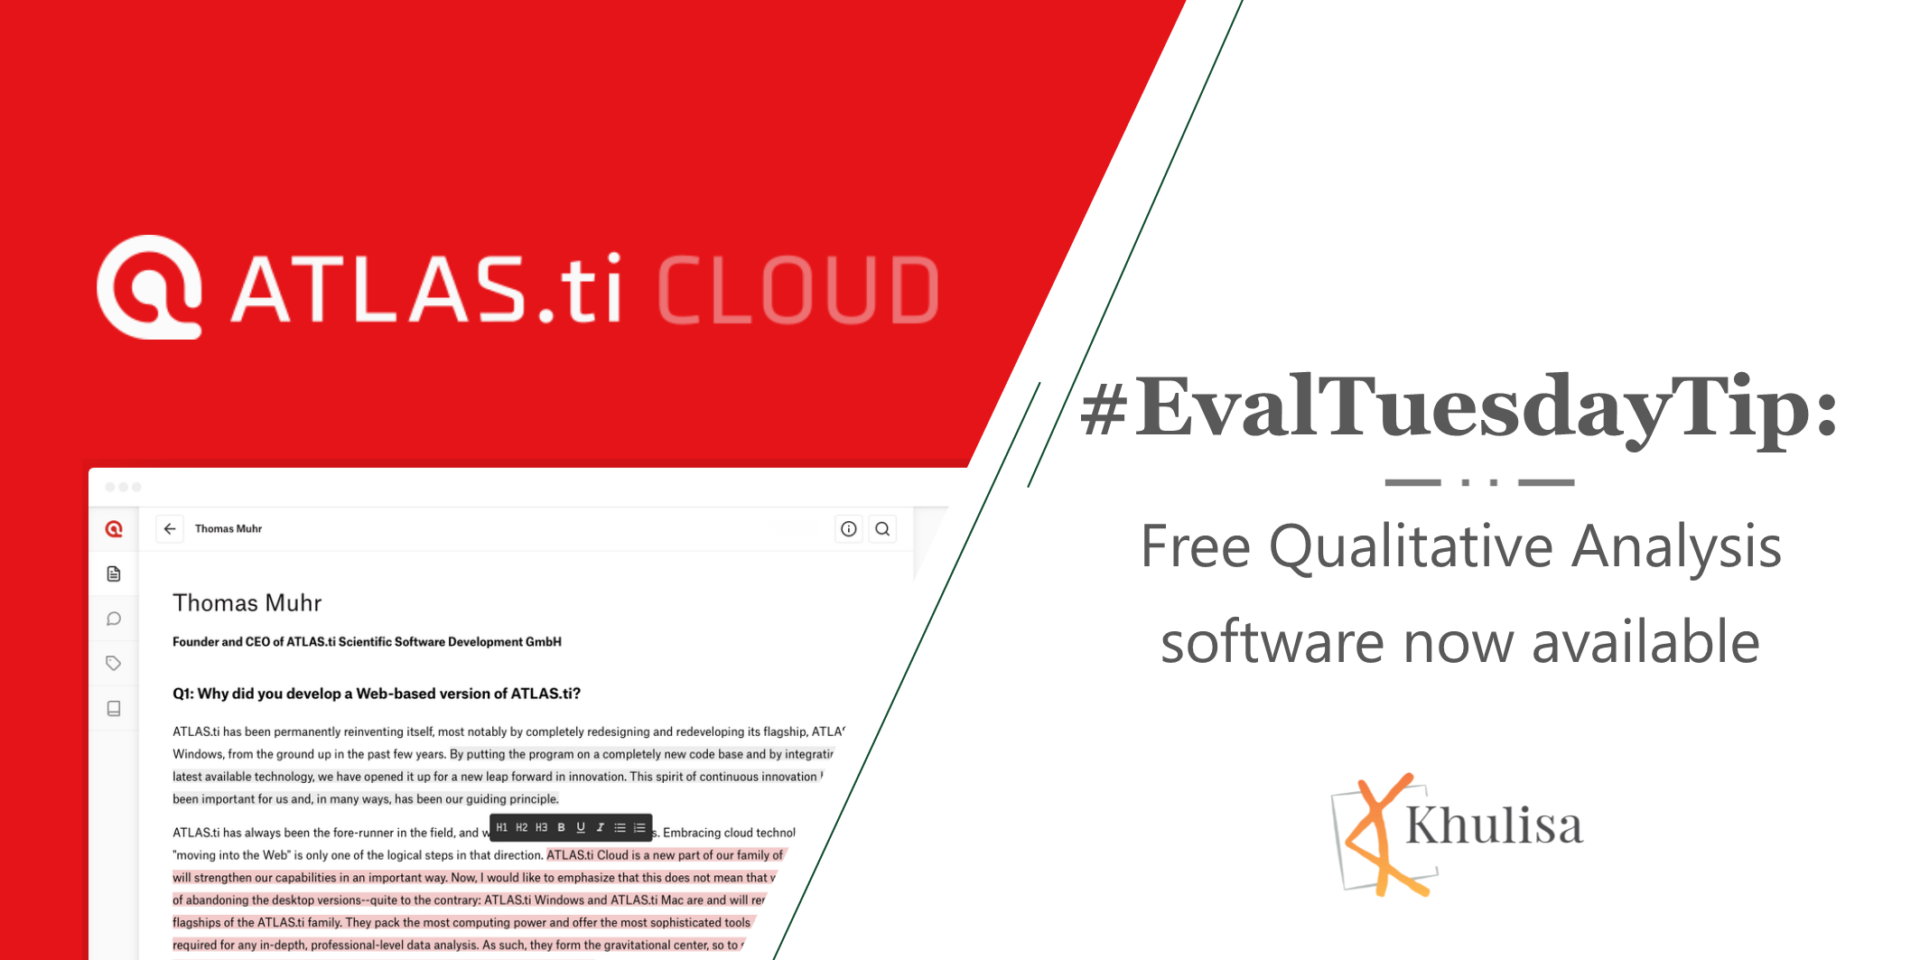
#EvalTuesdayTip: Free Qualitative Analysis software now available
Khulisa is thrilled about the launch of ATLAS.ti’s fully web-based version of its new cloud software. We use ATLAS.ti to analyze qualitative data from Khulisa

Khulisa is thrilled about the launch of ATLAS.ti’s fully web-based version of its new cloud software. We use ATLAS.ti to analyze qualitative data from Khulisa
Khulisa finds the series of tools curated by ImpactGuide.org useful to measure the effects of advocacy through films or documentaries. For example, ConText, evaluates a

Khulisa recently discovered Switchit – an innovation that lets you share your digital business card with anyone, via text, whatsapp or email. It’s a
Khulisa often works with organizations who only have a partial evaluation culture. This article by Evaluation into Action called Building a Culture of Program Evaluation provides insight
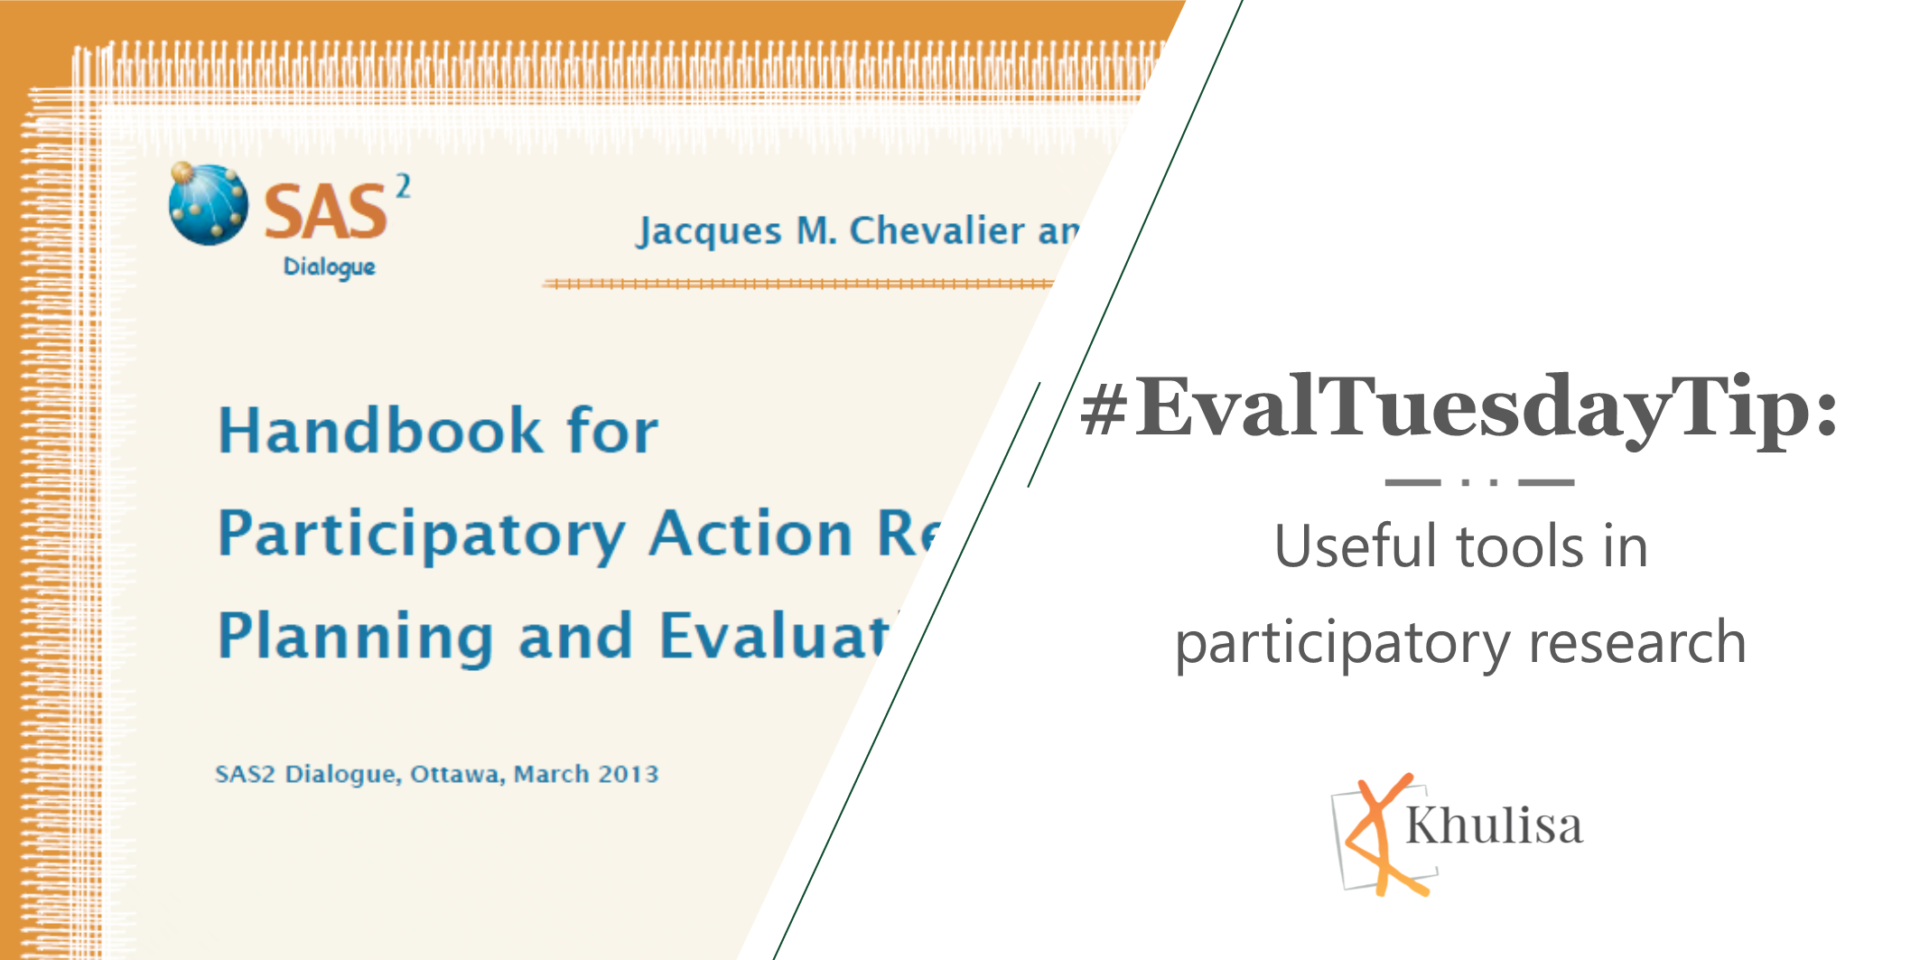
Khulisa finds the many new (and previously used) participatory research tools in this handbook very useful in client evaluations.Some of the practical techniques referenced in
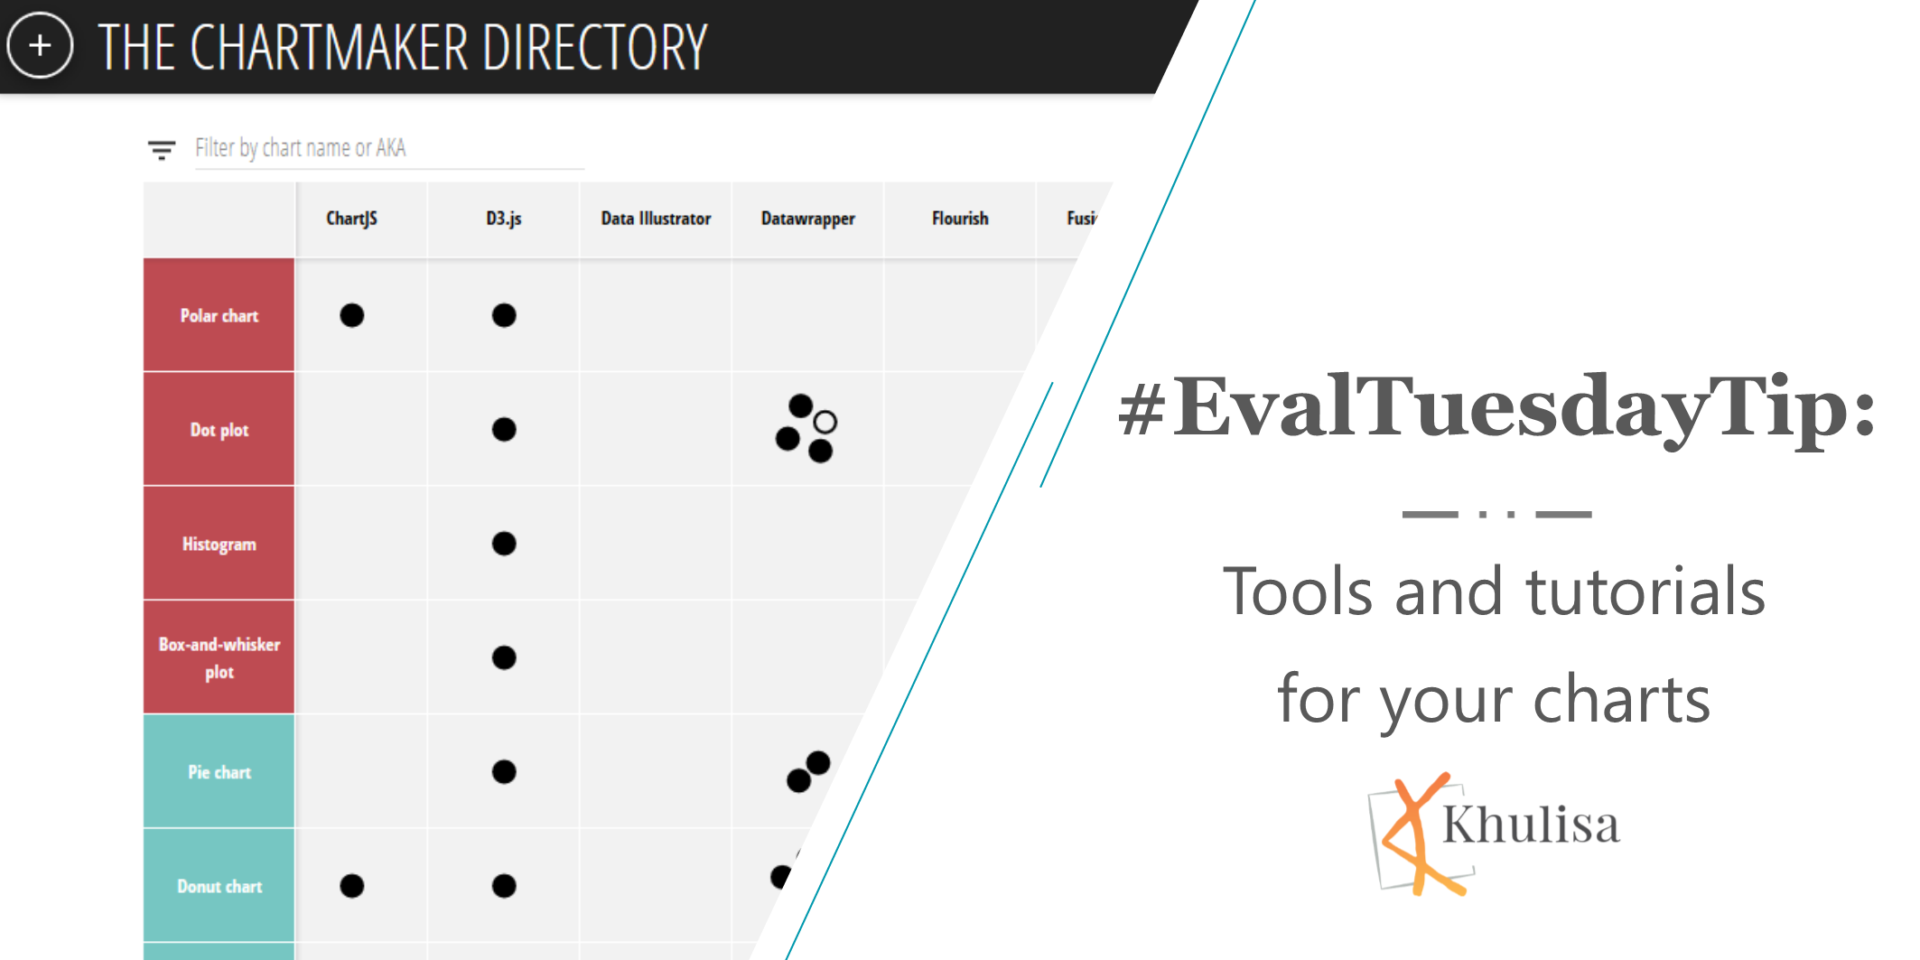
The Chartmaker Directory is a useful website to find the right tool to create charts for communicating #evaluation findings. The directory includes more than 50
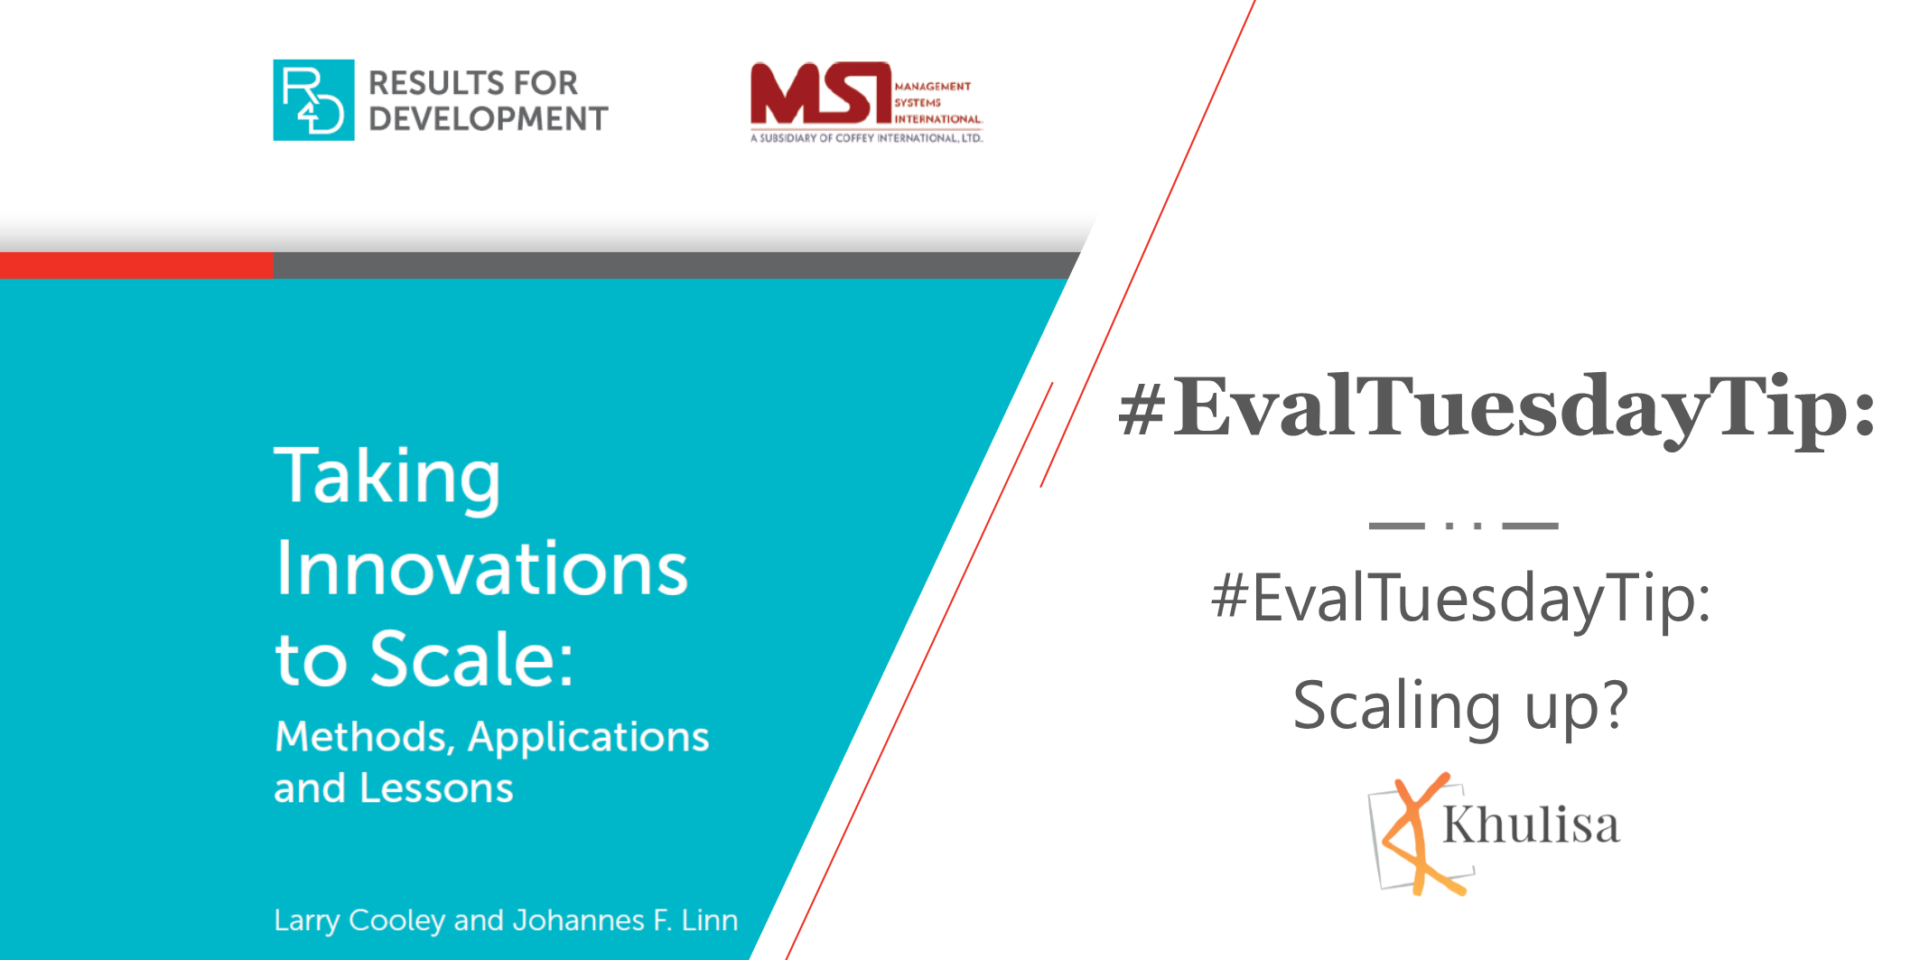
Khulisa is often asked to measure the potential for projects to scale up their activities. This freely downloadable document called “Taking Innovations to Scale: Methods,
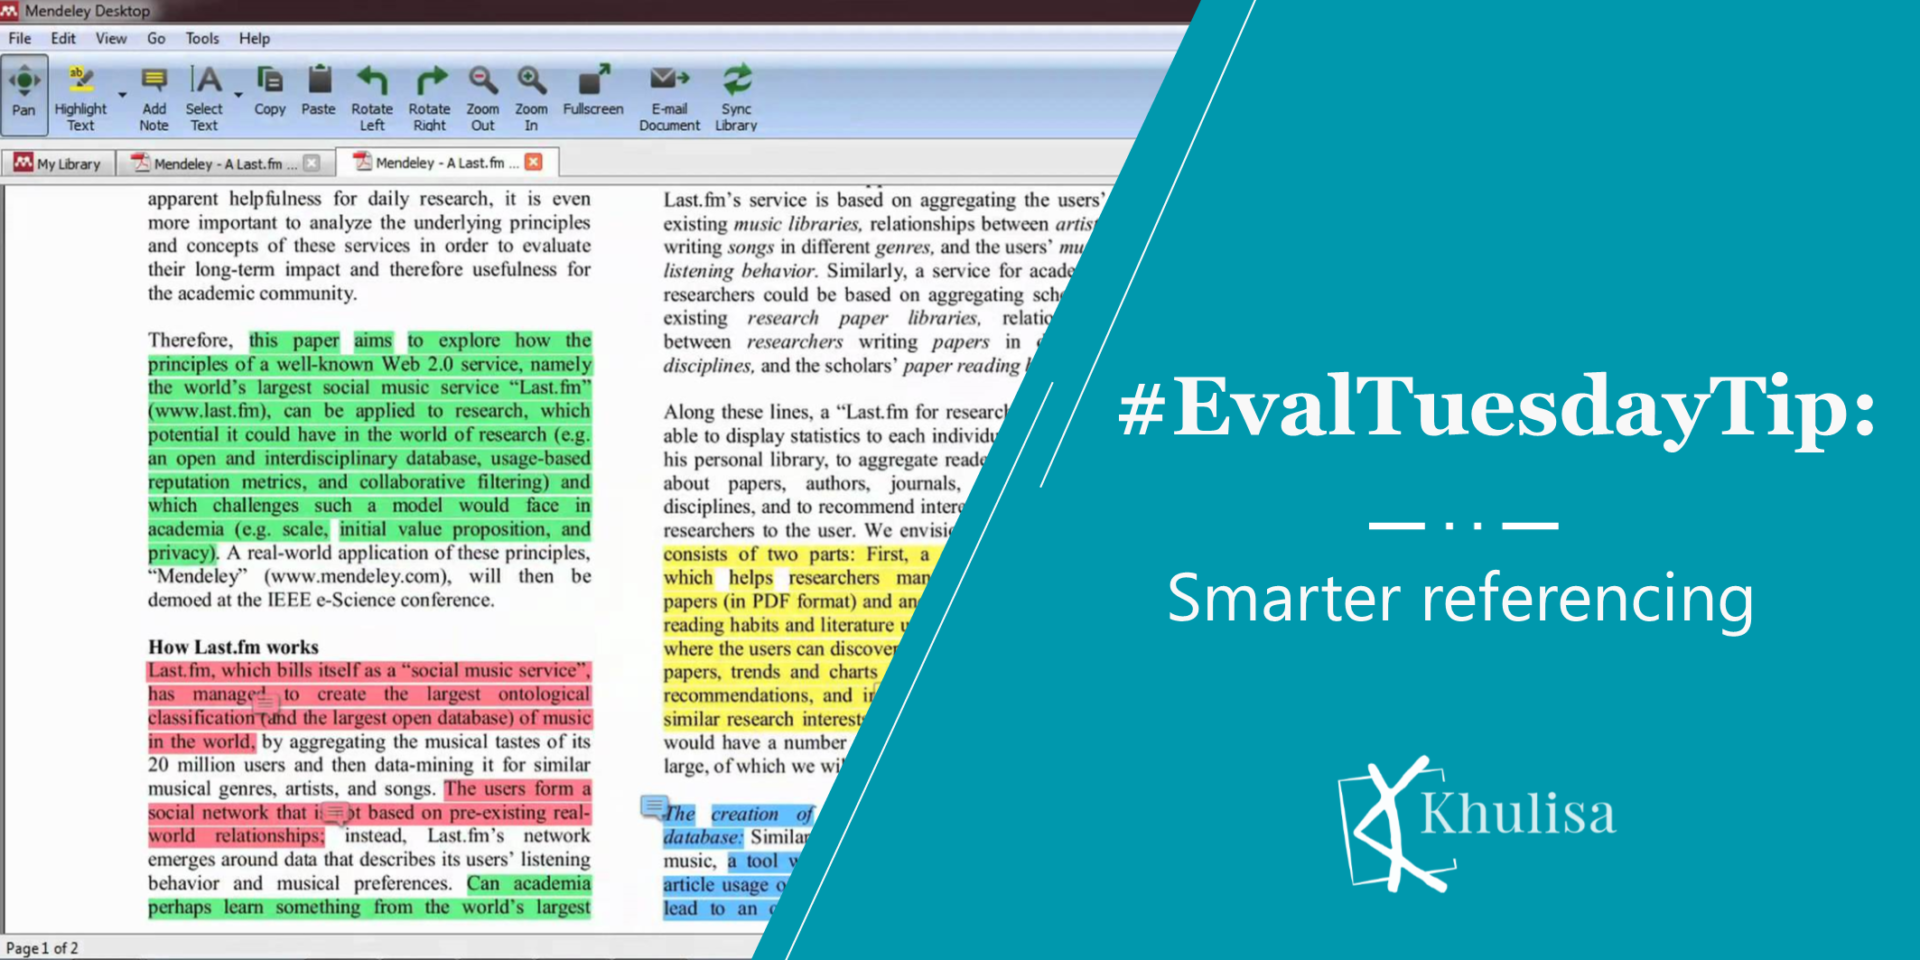
Khulisa finds Mendeley to be one of the best free referencing tools because of its user-friendliness. Mendeley is a desktop application that has a MS
Khulisa finds this fun video by Ann-Murray Brown about logframes in evaluation helpful and used it to introduce M&E to BRIDGE’s Early Childhood Development Community
Ripple Effect Mapping (REM) is an interesting type of impact evaluation methodology that uses elements of Appreciative Inquiry, mind mapping, and qualitative data analysis to engage program participants and