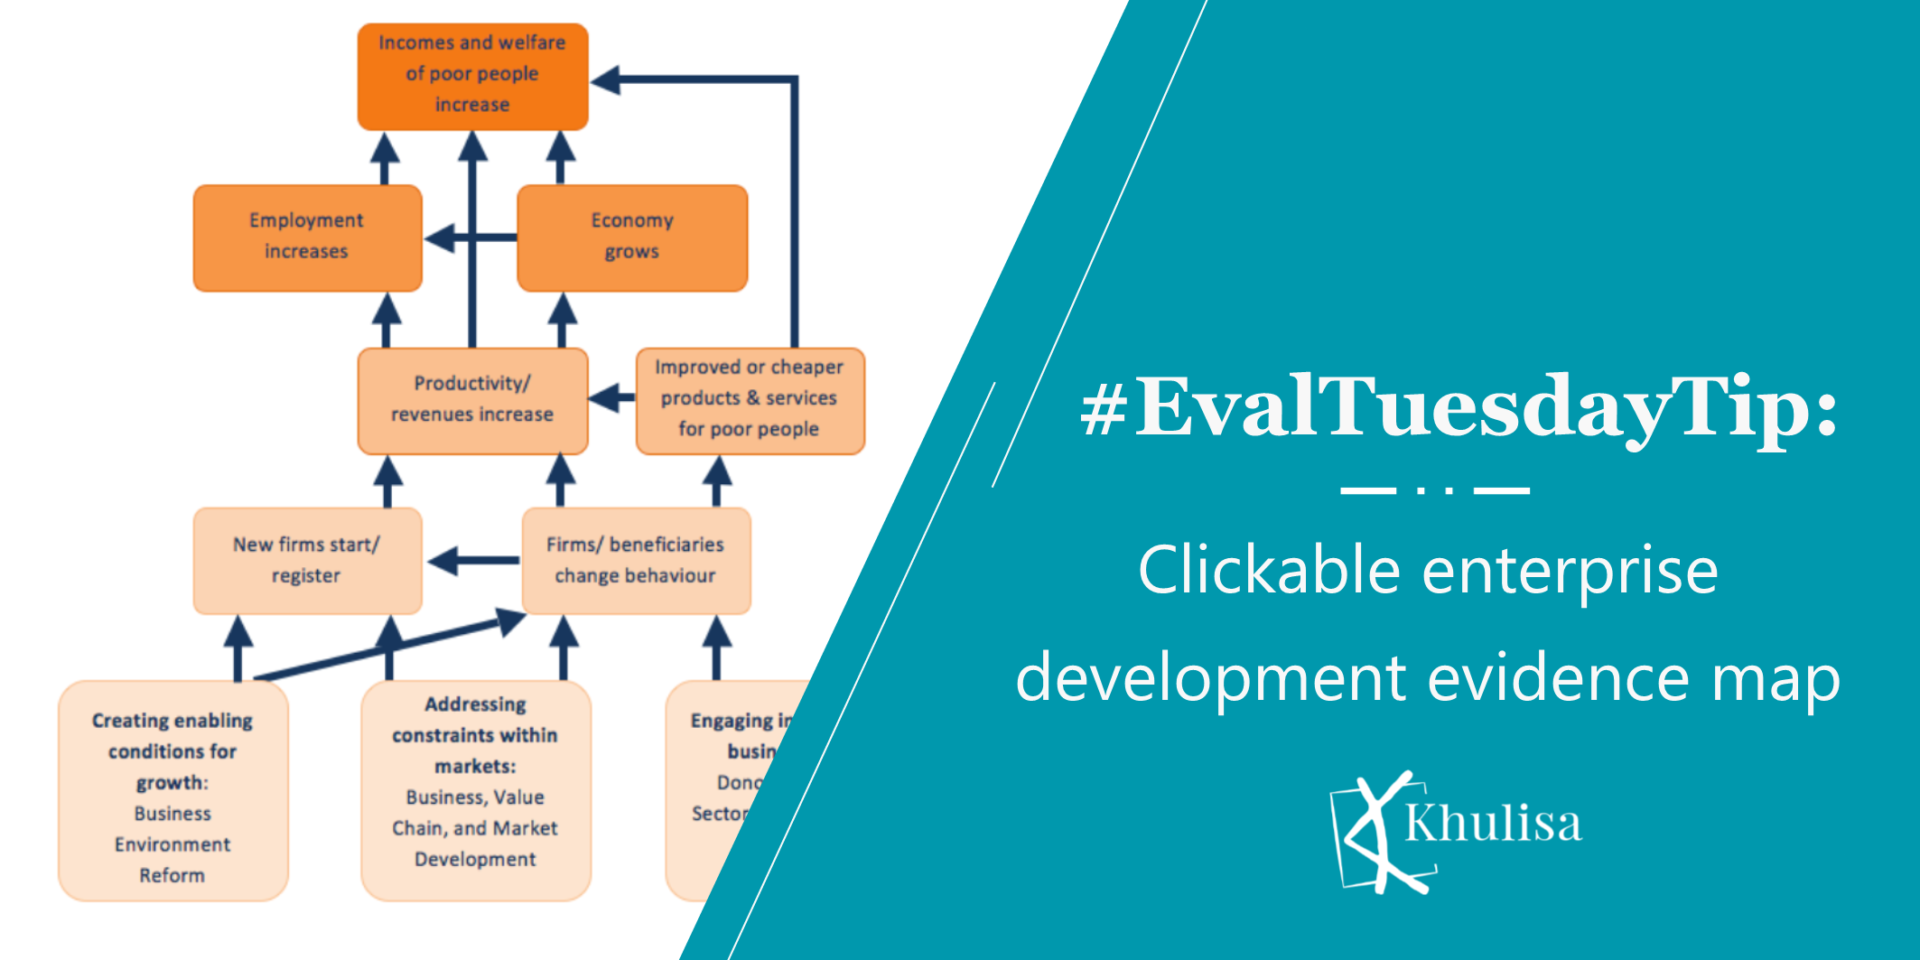
#EvalTuesdayTip: Clickable enterprise development evidence map
This is a really cool way for evaluators to show the evidence supporting a Theory of Change in a (clickable) evidence map for economic development.
This is a really cool way for evaluators to show the evidence supporting a Theory of Change in a (clickable) evidence map for economic development.
Khulisa loves the evaluation insights found in Rick Davies’ article entitled “Representing Theories of Change: Technical Challenges with Evaluation” published in 2018 by The Centre
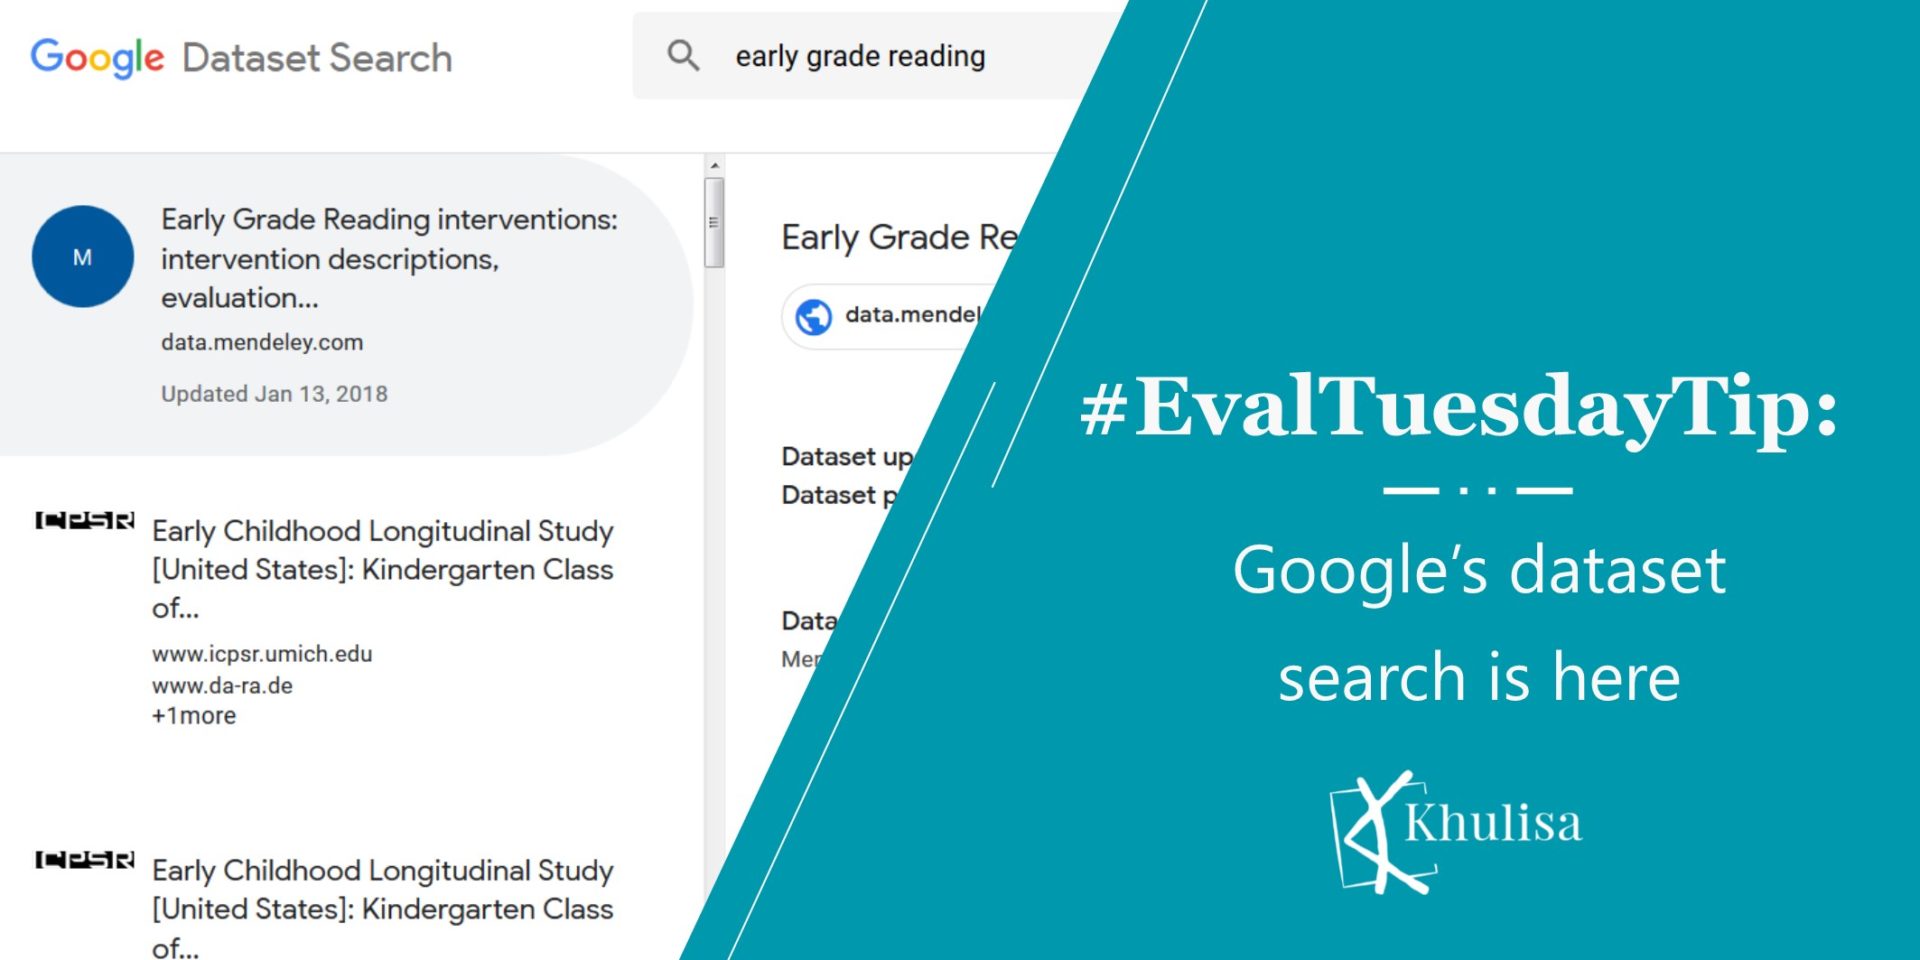
Access to secondary data is a challenge for many evaluators. Khulisa is excited to learn about Google Dataset Search, a new initiative by the search
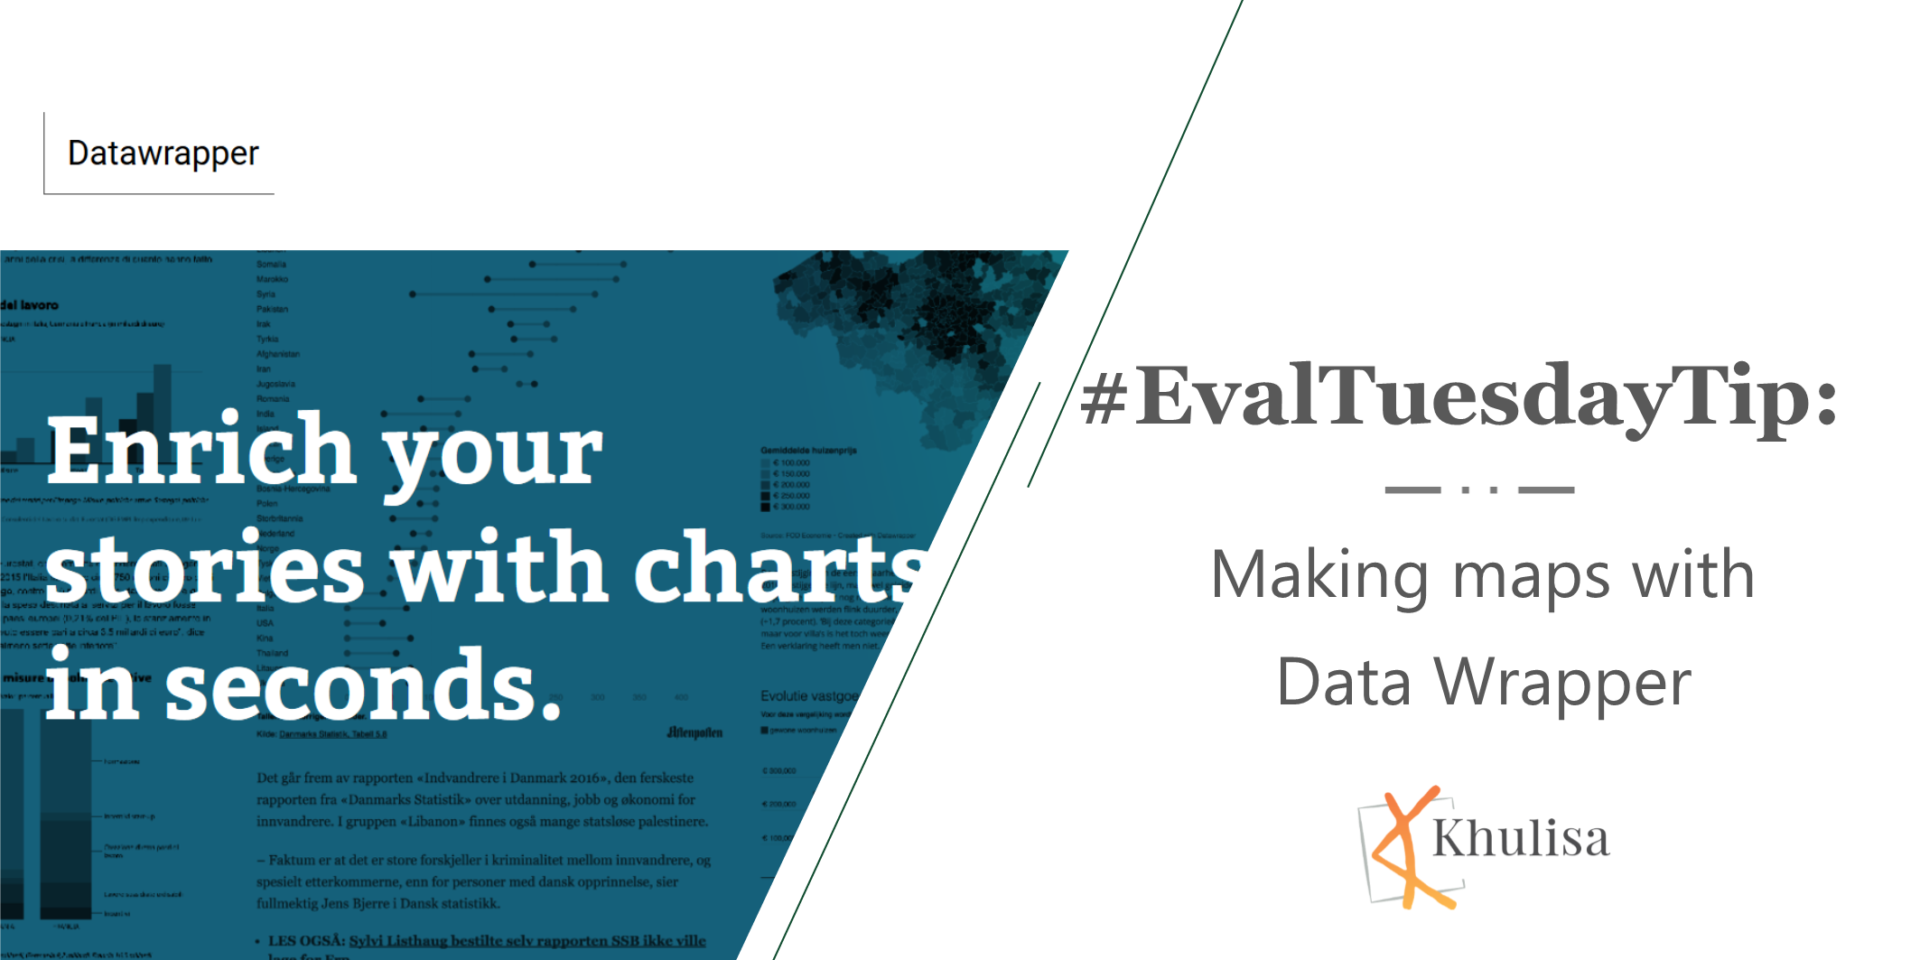
Data Wrapper is the go-to data viz platform for media and publishing professionals. Media houses like the Washington Post and the Guardian use it to
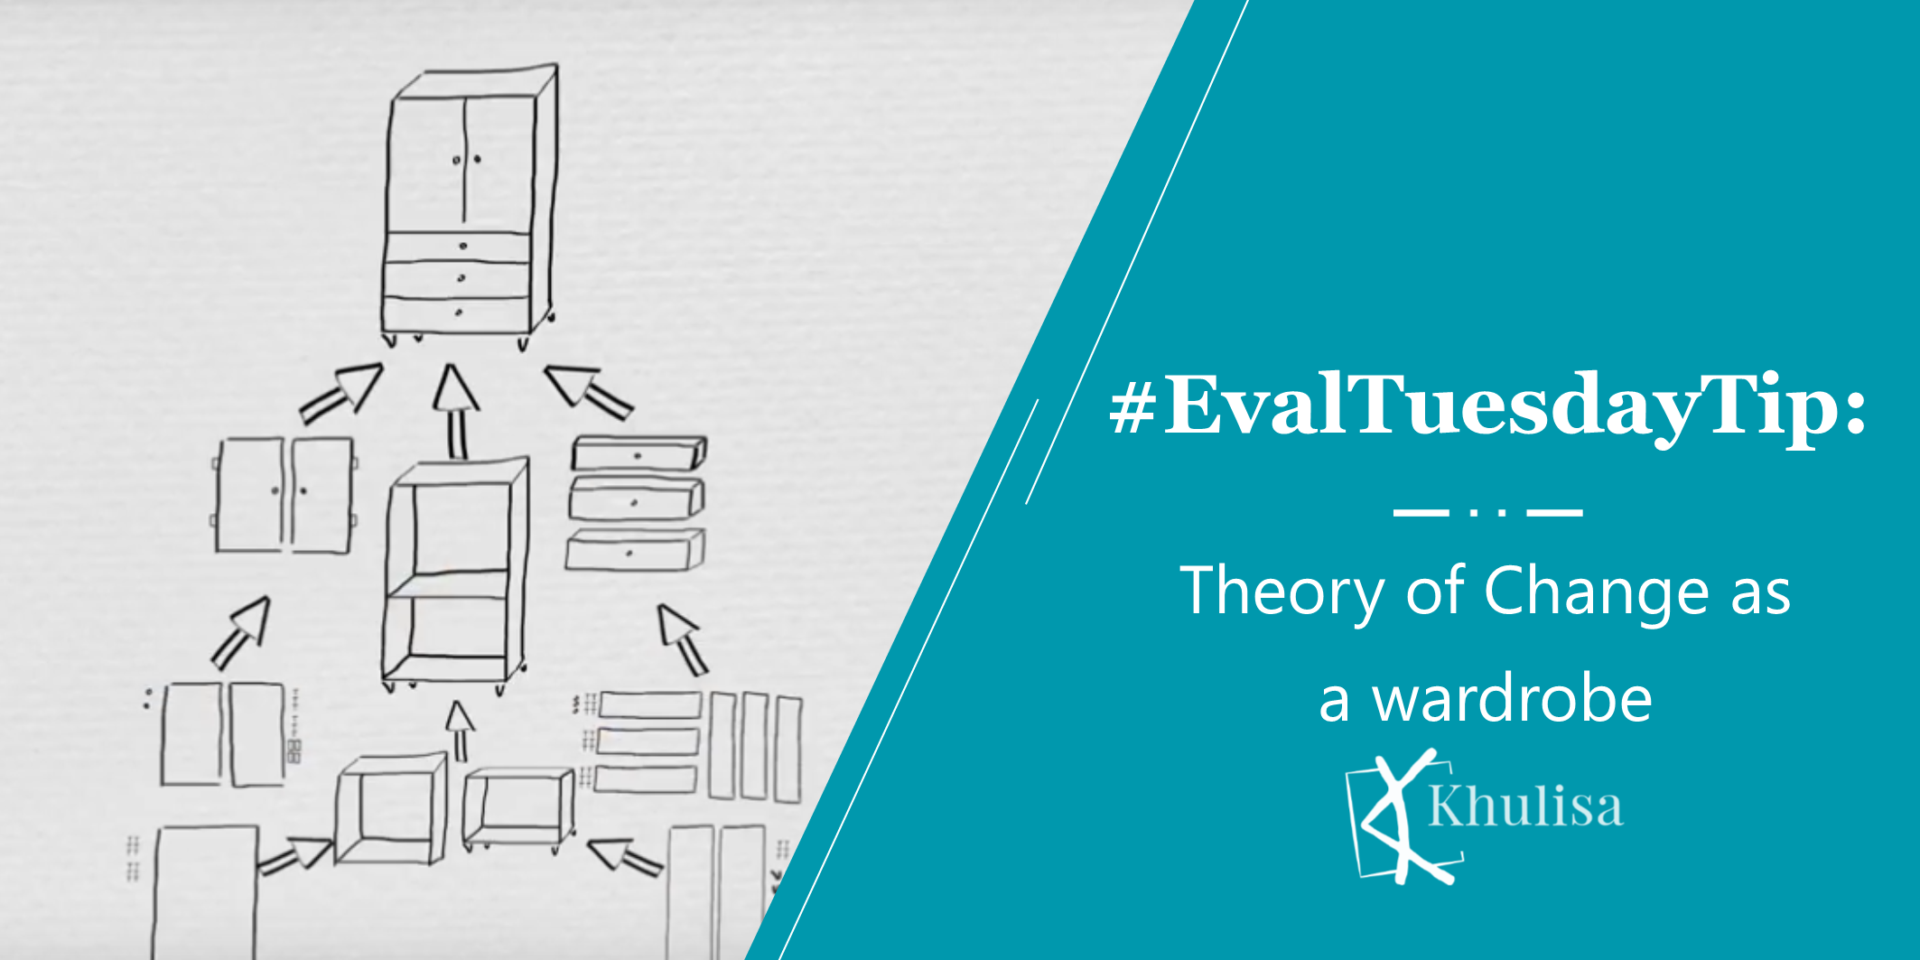
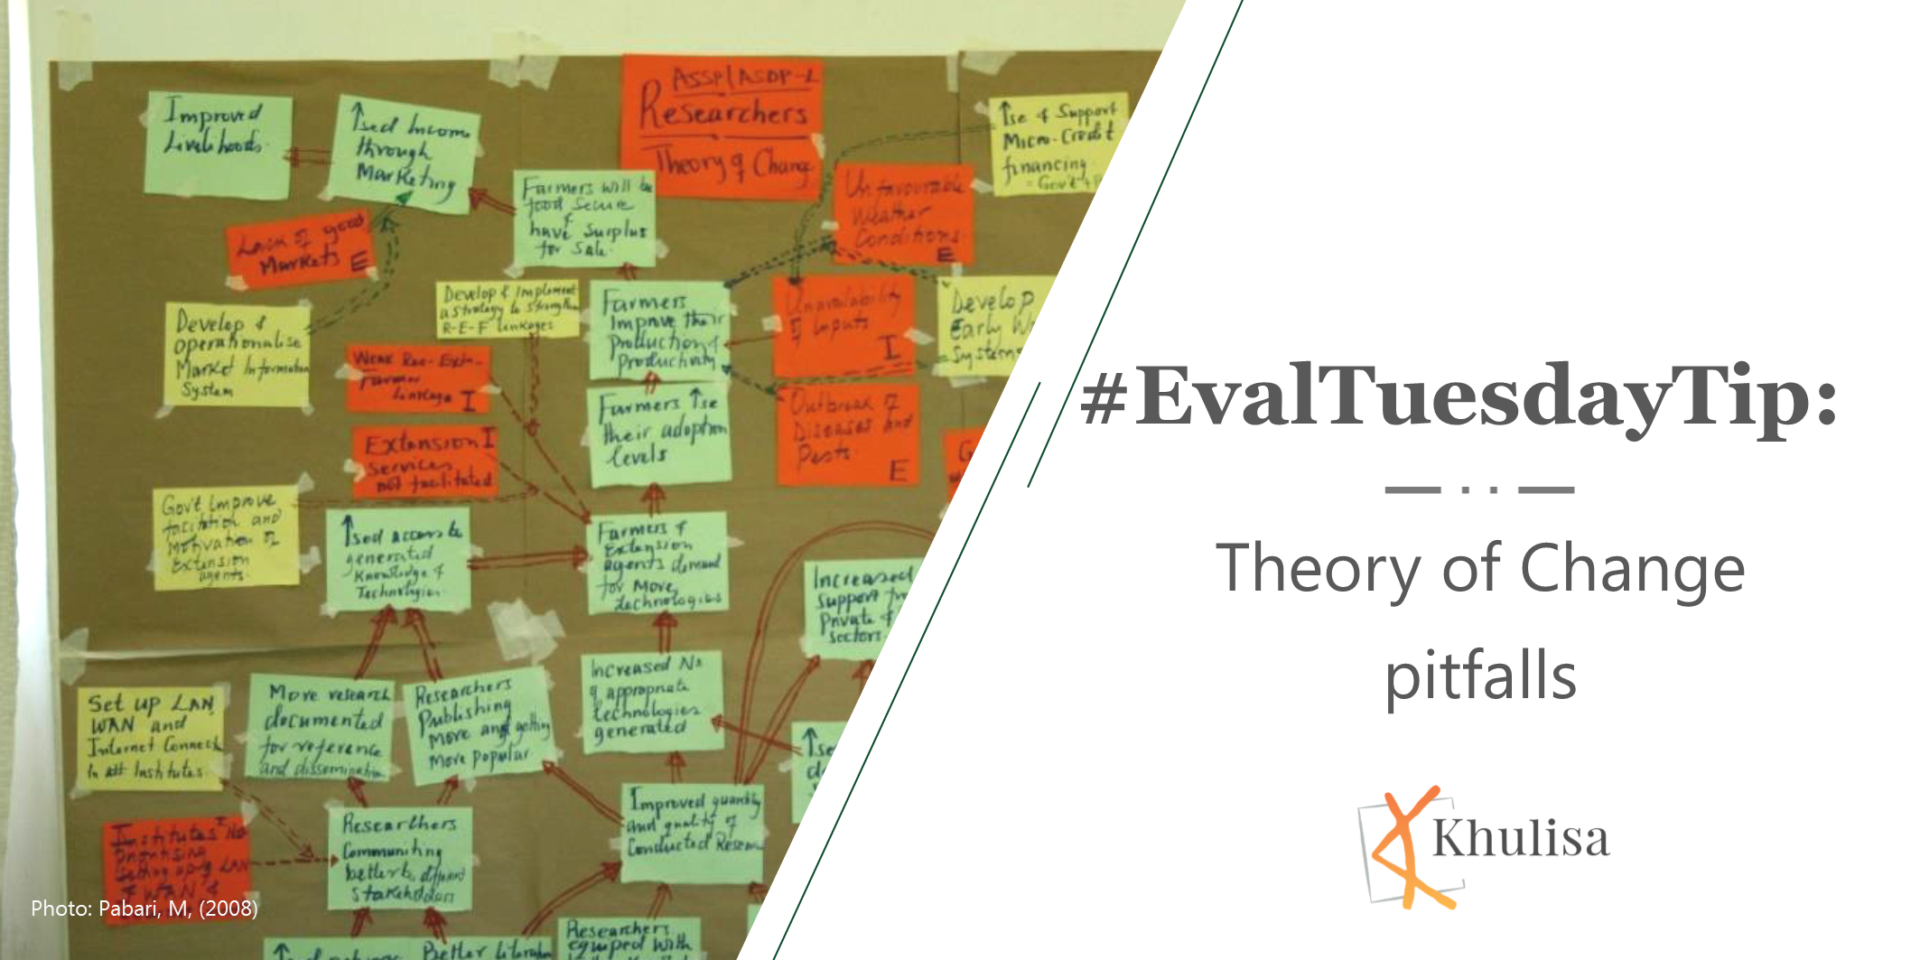
This video explains the components of a theory of change in a simple, conceptual way using the assembling of a wardrobe as analogy. The drawers
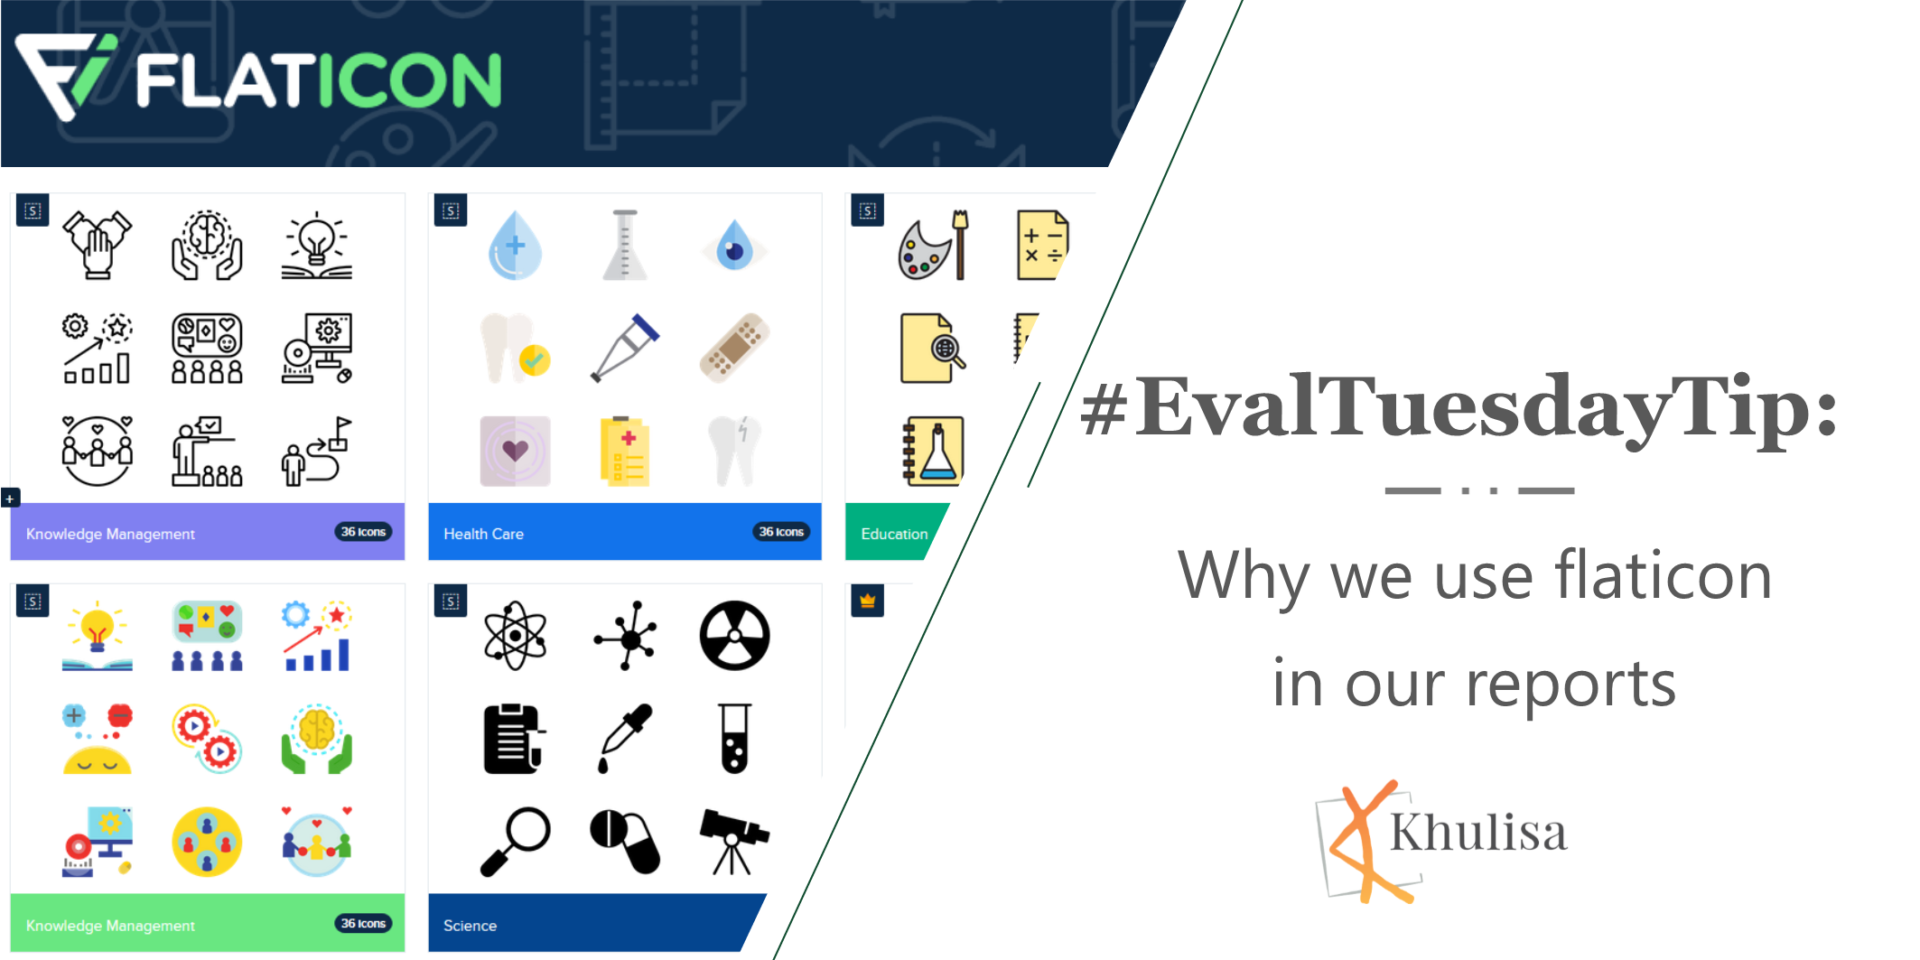
Khulisa uses icons in many of our evaluation reports to draw our readers’ attention to important messages, illustrate themes and simplify complex concepts. One of

The International Development Research Centre (IDRC) has developed a new approach for measuring the quality of research, aside from peer reviews. See this resource
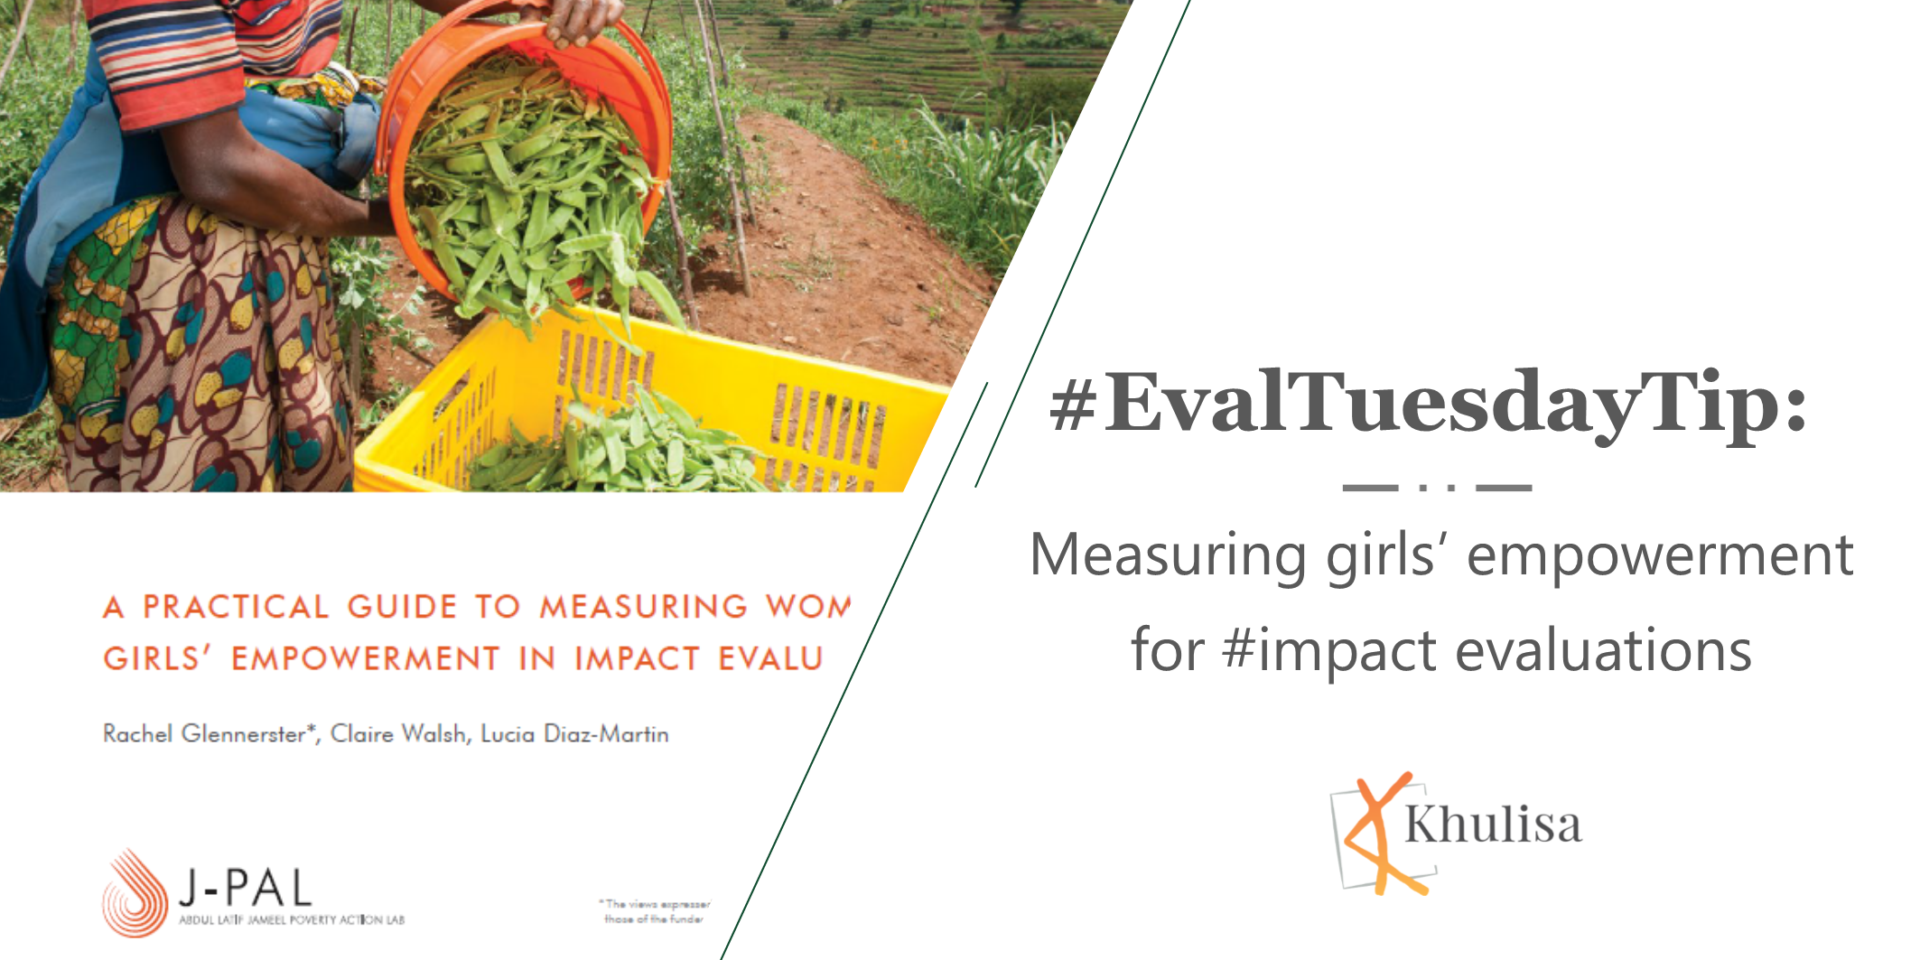
Khulisa found this practical guide from the Abdul Latif Jameel Poverty Action Lab (J-PAL) useful to measure women and girls’ empowerment through impact evaluations. The
Khulisa continues to advise clients on the importance of a data culture, focussing on the collection, analysis and use of data. This excellent article by
Good evaluation reports require strong writing. Khulisa has started to use WritersDiet, a cool test developed by Prof Helen Sword, to help us assess our