#EvalTuesdayTip: Join a Civil Society Group
As discussed in this week’s blog EvalPartners turns ten years old this week. EvalPartners, which defines itself as “a global partnership between Voluntary

As discussed in this week’s blog EvalPartners turns ten years old this week. EvalPartners, which defines itself as “a global partnership between Voluntary
By guest author and skilled evaluator, Kavita Mittapalli, PhD MNA Associates, Inc. “OMG, I got played by a client who promised me work!” “They took

Khulisa, together with its partners at LASER PULSE, recently completed a study on the nature and scope of trafficking in persons (TIP) in South Africa.
Khulisa, together with its partners at LASER PULSE, recently completed a study on the nature and scope of trafficking in persons (TIP) in South Africa.
Khulisa, together with its partners at LASER PULSE, recently completed a study on the nature and scope of trafficking in persons (TIP) in South Africa.
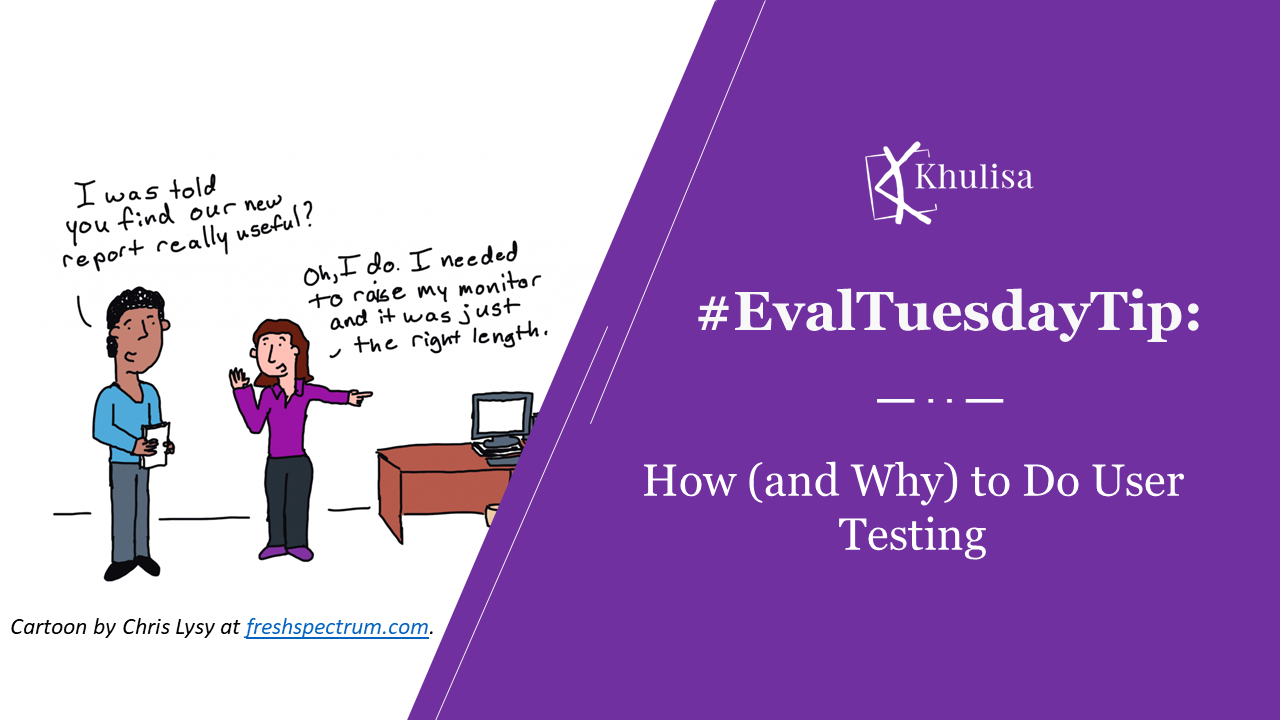
Cartoon by Chris Lysy at freshspectrum.com. Before reporting the results of an evaluation, it’s essential to ensure you’ve reported the results in a way that

BenitaWilliams, one of our partner evaluators in South Africa, recently sent us areminder about the appropriateness of Qualitative Comparative Analysis (QCA) asa method for tracing
Fourth in a series of tips about data visualization (data viz) myths and how to avoid their pitfalls. MYTH: Data viz consists of plotting multiple
Third in a series of tips about data visualization (data viz) myths and how to avoid their pitfalls. MYTH: When visualizing a complex dataset, highlight
Second in a series of tips about data visualization (data viz) myths and how to avoid their pitfalls. MYTH: Using jargon helps my data sound